For people in rural parts of the world, receiving vital information about water sources contaminated with cholera was nearly impossible — until now.
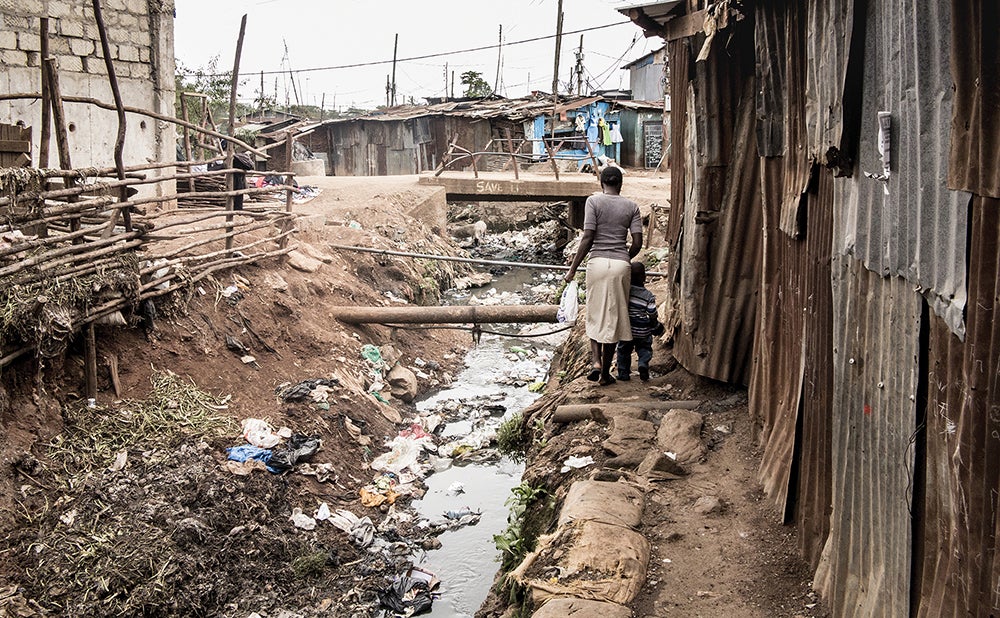
Cholera, a serious illness caused by consumption of food or water containing the bacteria Vibrio cholerae, has been quietly killing people for decades. Globally, we are in the seventh cholera pandemic, which officially began in 1961. The strains have largely persisted in South Asia and Sub-Saharan Africa. The disease is currently endemic in South Asia and continues to erupt in force in new countries in Africa every few years. According to the Centers for Disease Control and Prevention, an estimated 1.3 million to 4 million people globally contract cholera each year and 21,000 to 143,000 people die from it.
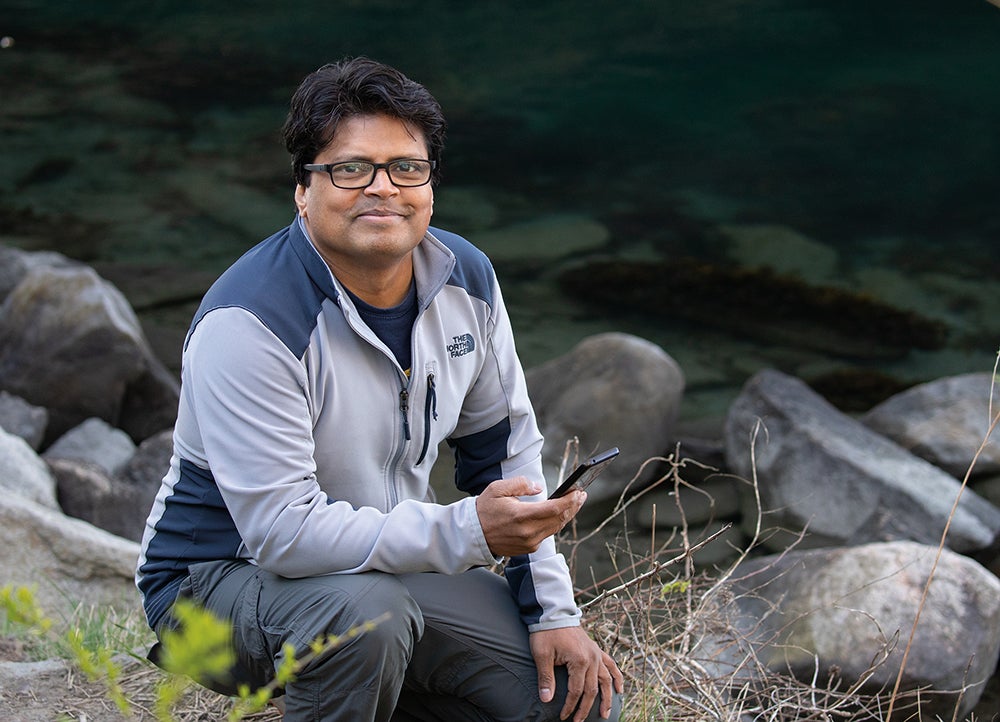
Ali Shafqat Akanda, associate professor of civil and environmental engineering at the University of Rhode Island (URI), and his team completed a one-year trial in the fall of 2022 of a cell phone app designed to provide non-technical, actionable information about high-risk locations and potential spikes in cholera infection rates to people living in remote areas in Bangladesh.

The project team includes Sonia Aziz, associate professor of economics at Moravian University in Pennsylvania; Emily Pakhtigian, assistant professor of public policy at Pennsylvania State University; and Kevin Boyle, a professor of agricultural and applied economics at Virginia Tech University. At URI, PhD students Farah Nusrat and Abdullah Islam helped build the cholera risk model and the app, respectively. On the ground in Bangladesh, the International Centre for Diarrhoeal Disease Research, was critical for the deployment and success of the app.
Akanda has spent more than a decade researching the water and climate origins of cholera infection in the South Asia region and methods to prevent the disease.
“When I started looking at the outbreaks in Bangladesh, my first observation was that cholera comes in two waves: one in the spring when there is little water, and one in the fall after the monsoon season when there is a lot of water,” he says.
He saw that drought conditions forced people to share the limited water supply. Daily activities, such as bathing in the water, watering livestock, and eating and drinking, all from the same source caused problems.
Later, heavy rains of the monsoon season washed the contaminated waters into new locations, which meant that concentrated areas of infection became more widespread.
Addressing the source of infection
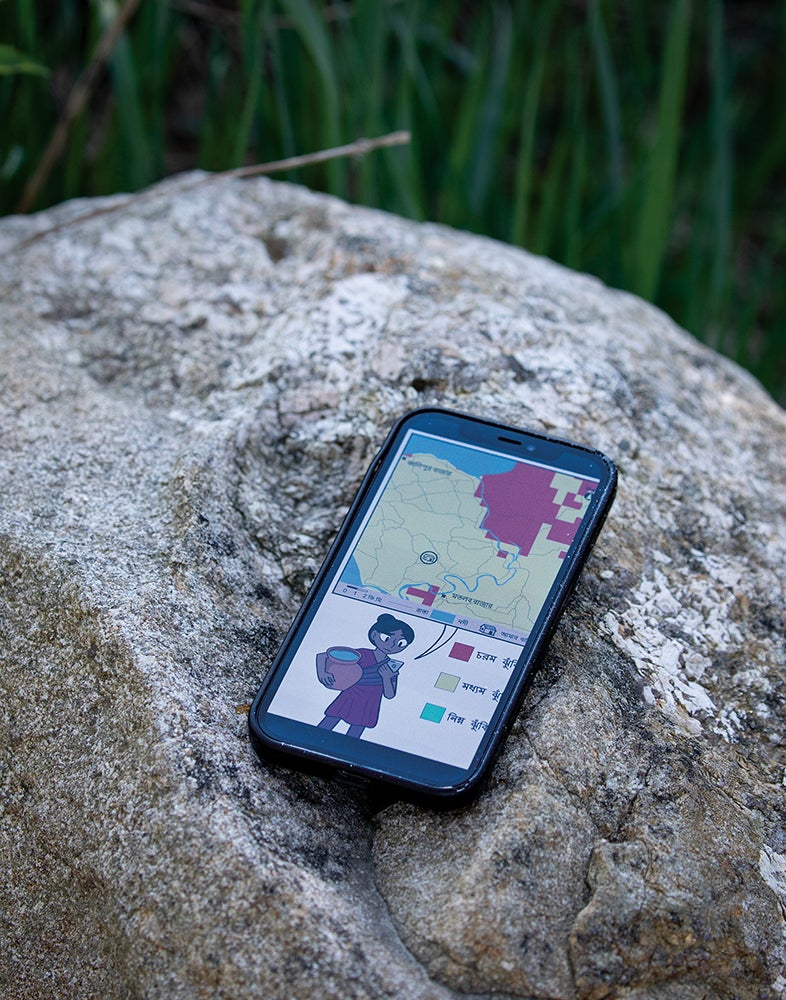
Akanda began to assemble cholera disease data in 2007 to determine the correlation between these two water events and infection rates. Hospitals in Bangladesh already kept records of infections, and he constructed a long duration time-series to investigate the hydro-climatic drivers of cholera. Vital information about rainfall amounts, flood records, water levels, water scarcity and regional water bodies came from NASA operated satellites. The satellite data driven models enabled Akanda’s team to generate monthly risk maps showing areas affected, and populations at higher risk, and lets people prepare for likely infection rates.
Akanda knew that the app had appeal to users and would encourage them to look for the specially colored maps that told them which areas posed high risk for cholera
Still, Akanda felt more could be done with the information. Until about 2019, his main audiences were the government, public health offices, his partners in Bangladesh, and water resources and public health focused research institutions in South Asia. However, the information was not reaching the people who would benefit from it the most — people living in rural communities.
So Akanda, Aziz, Pakhtigian and Boyle created a more direct method of reaching the remote villages of Bangladesh through a cell phone app.
Cholera map
While many remote locations were too isolated to have access to land lines, villagers often had smart phones. With the help of his collaborators and the URI graduate students, Akanda designed an app specifically designed for communicating risk to nontechnical populations.

“If the information can be delivered through an app in an interactive and user-friendly way, perhaps it will work,” he says.
Akanda knew that the app had appeal to users and encourage them to look for the specially colored maps that told them which areas posed high risk for cholera.
Catering to users
Akanda flew to Bangladesh in August 2020 to visit family and conduct his research. He bought inexpensive smartphones like what people in local villages would use. Upon his return to URI, he and his team began building and testing the app.
Research found that women are most likely to use the app since it is often their responsibility to obtain water and maintain their children’s health.
“This app allowed us to deliver highly technical information from state-of-the-art NASA satellites directly to remote, grassroots populations in vulnerable regions of the world using the power of smartphones.”Ali Shafqat Akanda
The team held dozens of online Zoom interviews with hundreds of villagers as app components were created and refined.
“The team would show graphics to the villagers weekly and ask what they understood from the graphics, whether the text is legible, if they could interpret the maps,” Akanda explains. “In the end, we found out that about 70% of our users were women, and the message of the app was well received by them.”
Akanda and his team deployed the app in 1,500 households, 750 for a control app and 750 with an app with the interactive maps.”
The test
The team conducted a one-year trial of the app to capture the annual cycle of water scarcity and monsoon rainfall on cholera. Villagers received monthly updates on whether they were in a high-risk zone and whether they should boil their water before using, along with other tips on proper sanitation and hygiene.

The URI students maintained daily data collections to keep the outbreak predictions accurate. Users received a text message every time new maps were published. Based on the data collected on app usage, water practices and health outcomes during the trial period, they found the app reduced environmental water usage by 23% in men and 25% in women.
“At times of high risk, we found that fewer people were using natural water sources like the ponds, rivers, and streams,” Akanda explains. “Users were more likely to safeguard themselves from exposure to cholera.”
The next phase will include introducing the app to more villages for additional testing from different regions. Akanda also wants to see how the app can be made more effective and whether the technology can be deployed on a much larger scale.
“There is a tremendous opportunity where this could be expanded — population growth and climate change are factors to water security,” Akanda says. “This app allowed us to deliver highly technical information from state-of-the-art NASA satellites directly to remote grassroots populations in vulnerable regions of the world using the power of smartphones.”
