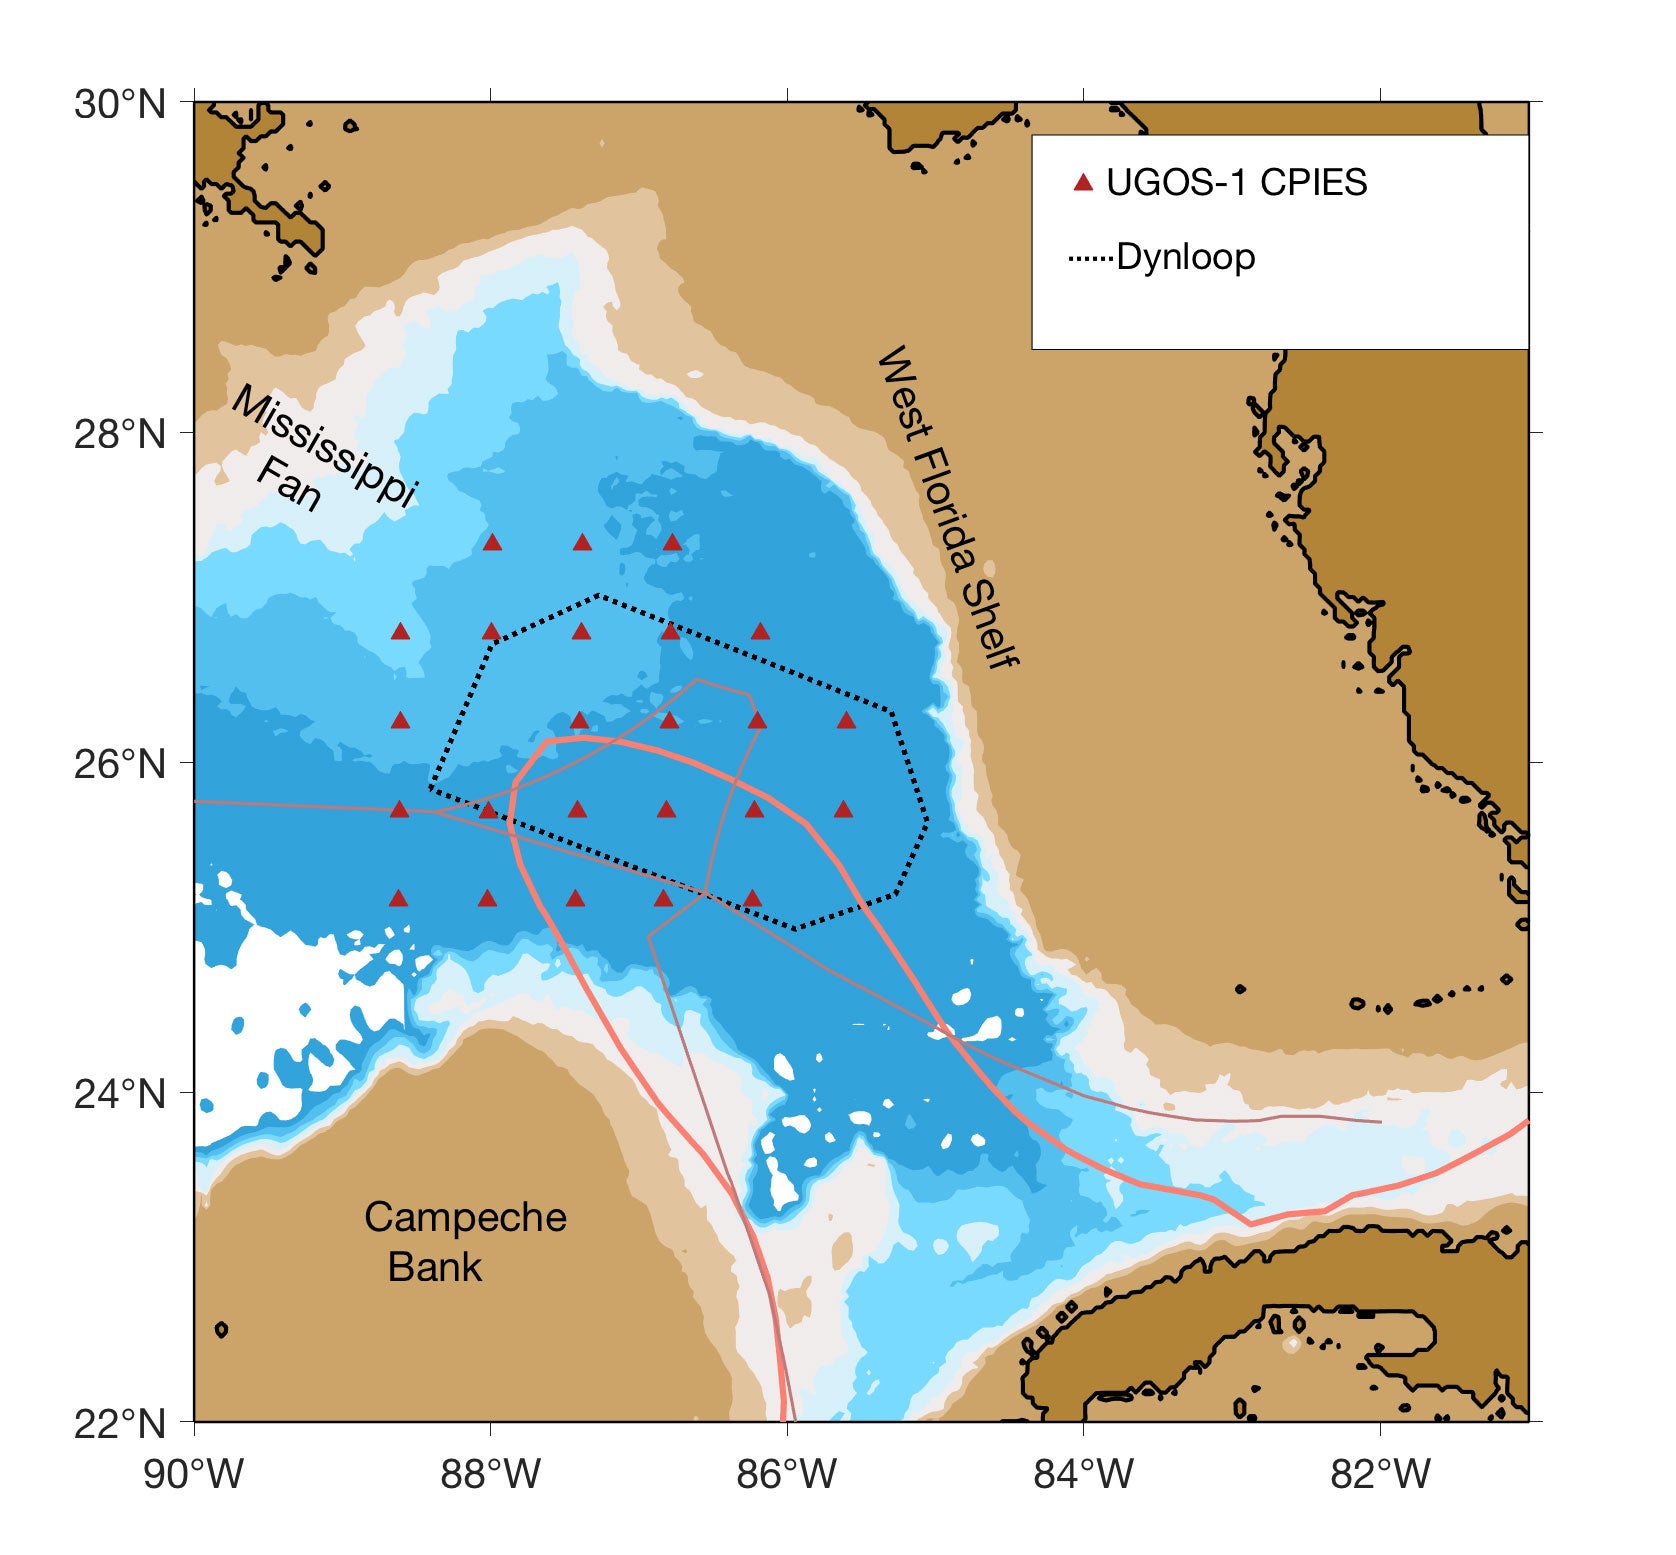
Shown at right is the UGSO-1 array consisting of 25 current- and pressure-recording inverted echo sounders (CPIES) sites (red triangles). The extent of the dynloop mapping area is designated by the dotted line. The mean position of the Loop Current is shown by the orange line. The Exclusive Economic Zones of the U.S., Mexico, and Cuba are delineated by the brown line.
CTD Data
Calibration CTD casts were taken at each site.
- Deployment Cruise PE19-28, June 2019
(Zip archive of netcdf files) - Telemetry Cruise PE20-06, September – October 2019
(Zip archive of netcdf files) - Telemetry Cruise PE21-05, September – October 2020
( Zip archive of netcdf files) - Recovery Cruise PE21-20, May 2021
( Zip archive of netcdf files)
CTD data for both 2019 cruises is also available from the National Centers for Environmental Information: NCEI Accession 0209160.
CTD data for the 2020 cruise is also available from the National Centers for Environmental Information: NCEI Accession 0224258.
ADCP Data
Subsetted, averaged Matlab format files from the Ocean Surveyor 75 kHz narrowband ADCP:
- Readme File
- Deployment Cruise PE19-28, June 2019
contour_xy.mat
contour_uv.mat - Telemetry Cruise PE20-06, September – October 2019
contour_xy.mat
contour_uv.mat - Telemetry Cruise PE21-05, September – October 2020
contour_xy.mat
contour_uv.mat - Recovery Cruise PE21-20, May 2021
contour_xy.mat
contour_uv.mat
Files from the Joint Archive for Shipboard ADCP at the University of Hawaii
- Deployment Cruise PE19-28, June 2019
Ocean Surveyor 75 kHz, Broadband SAC ID 02482
Ocean Surveyor 75 kHz, Narrowband SAC ID 02483
Workhorse 1200 kHz, Broadband SAC ID 02484
Workhorse 300 kHz, Broadband SAC ID 02485 - Telemetry Cruise PE20-06, September – October 2019
Ocean Surveyor 75 kHz, Narrowband SAC ID 02584
Workhorse 1200 kHz, Broadband SAC ID 02585
CPIES Data from Telemetry Cruise PE20-06
- Readme File
- CPIES Site Locations
- Bottom Pressure and Current Time Series
(tar archive of Matlab format files) - Bottom Pressure and Current Mapped Fields
(Matlab format file)
CPIES Data from Telemetry Cruise PE21-05
- Readme File
- CPIES Site Locations
- Bottom Pressure and Current Time Series
(tar archive of Matlab format files)
Recovered CPIES Data (June 2019 to May 2021)
- Readme File
- CPIES Site Locations
- Bottom Pressure
(tar archive of netcdf files) - Near-Bottom Currents
(tar archive of netcdf files) - Vertical Acoustic Travel Time
(tar archive of netcdf files)
Estimates of vertical profiles of temperature, salinity and geopotential anomaly
Sea Surface Height Anomaly
Underway Data
Underway data (ADCP, CTD, flurometer, GNSS, gyrocompass, met station, transmissometer, and TSG) are available from the R2R Rolling Deck to Repository
- Deployment Cruise PE19-28, June 2019, Cruise DOI: 10.7284/908448
- Telemetry Cruise PE20-06, September – October 2019, Cruise DOI: 10.7284/908287
- Telemetry Cruise PE21-05, September – October 2020, Cruise DOI: 10.7284/909015
- Recovery Cruise PE21-20, May 2021, Cruise DOI:10.7284/909368
Movies
- Near real time, global, merged, allsat, gridded sea surface height (SSH, color contours, contour interval 0.1 m) from the Copernicus Marine Environmental Service (CMEMS), bottom topography (gray contours, contoured in 500 m intervals between 1500 and 3500 m), and UGOS-1 array sites (gray triangles) from 13 June 2019 to 3 April 2020 at daily resolution
.avi format
.mov format - CPIES mapped bottom pressure (color shaded, contour interval 0.01 dbar) and currents (vectors), SSH (green lines), bottom topography (gray lines, contoured in 500 m intervals between 1500 and 3500 m), and UGOS-1 array sites (gray triangles) from 26 June to 20 September 2019 at two day resolution
.avi format
.mov format