After a pause because of the COVID-19 pandemic, participants in the 2020 Vis-a-Thon have recommenced their projects visualizing scientific research, working with faculty from the Rhode Island School of Design and the Edna Lawrence Nature Lab.
Projects
Jongsun Kim (URI), Narragansett Bay Zonation
Critic: Emma Hogarth
 Kim created two, three-dimensional maps based on his research into biological production zones in the Narragansett Bay. The boundaries of each zone were defined by the results of the nitrogen mass balance model. The maps, cut and etched on a laser cutter, are made of acrylic and LED lights of differing colors change according to the environmental situations present.

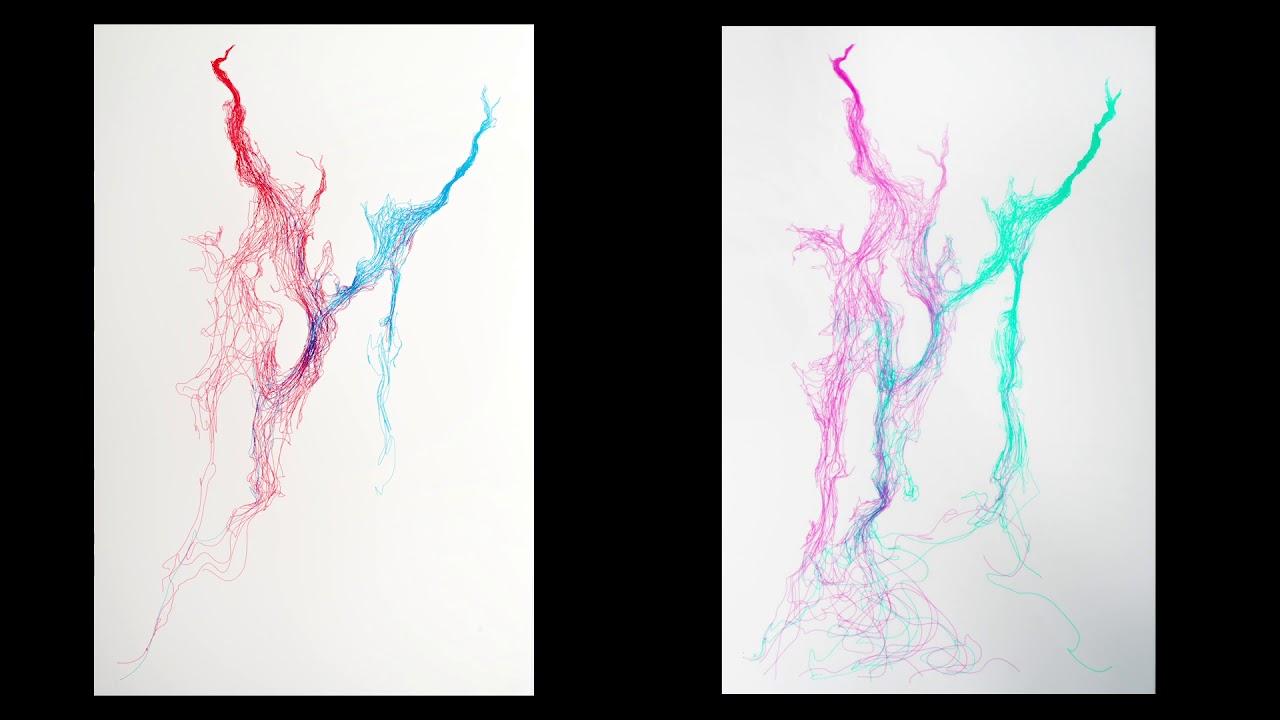
Kevin Rosa (URI), Drawing Drifter Paths
Critic: Rafael Attias
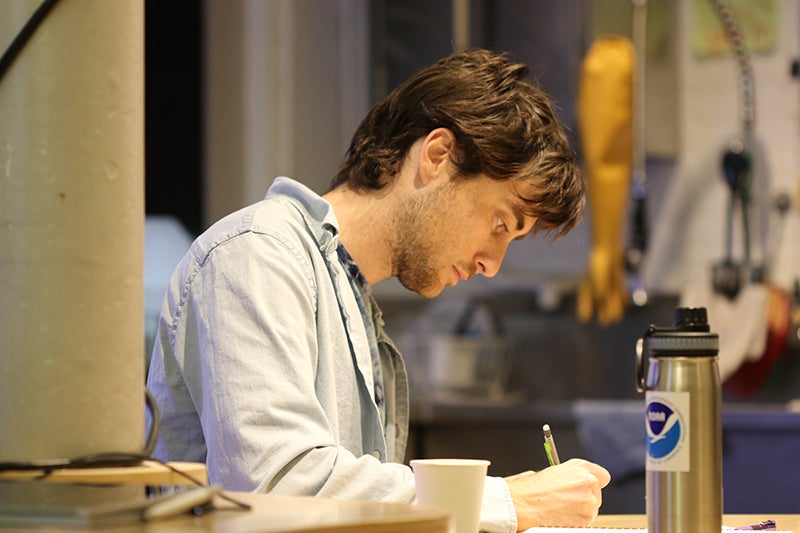
Using a drawing machine, Kevin is layering different drifter paths onto two-dimensional materials, allowing outcomes that show movement, time and place to emerge from empty space. Layering of these drifter paths allows for convergence and emergence of activity in Narragansett Bay and the Rhode Island Sound.
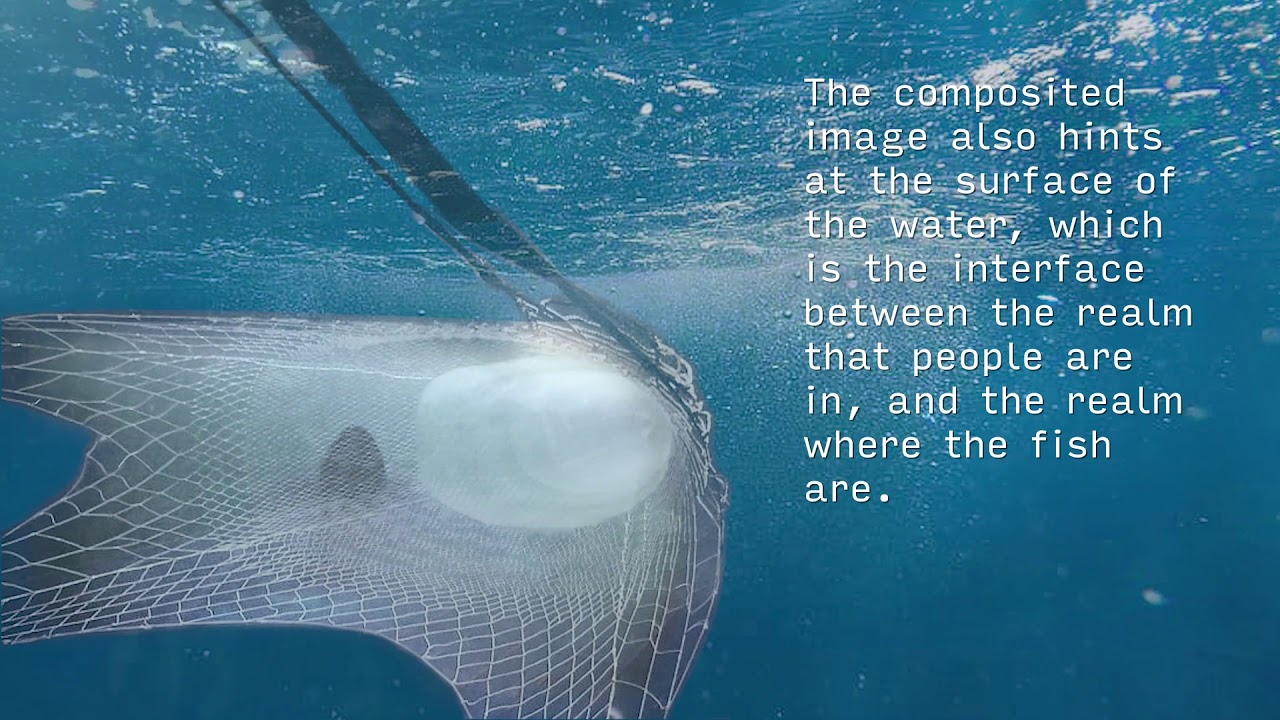
Maggie Heinichen (URI), You Can’t Count What You Can’t See
Critic: Vivian Charlesworth
Working with Adobe Photoshop and Premiere, Maggie created a looping video using images and audio to simulate the experience of fisheries sampling, while considering the concept of the ‘net’ as a grid that can conceal and reveal what you are able, or allowed, to see. Maggie used a collection of images and sound, both from her own archive and sourced from other resources, to convey what is happening in an impacted ecosystem.
Patricia Thibodeau (URI), Plankton Patterns
Critic: Rafael Attias
Thibodeau here visualizes the decrease of phytoplankton abundance due to long-term seawater warming and nutrient shifts in the Bay. Thanks to data from the Narragansett Bay Long-Term Plankton Time Series, Thibodeau averaged the seasonal phytoplankton abundance across three different decades and, inspired by intricate wallpaper patterns, created three 8’x 3’ hanging banners visualizing these plankton observations.

Jonny Benoit (Brown), Sound of the Bay
Critic: Rafael Attias

Jonny produced “audio-alizations” of Narragansett Bay observations taken in 2018. He describes it as, “taking a year’s worth of temperature data from five different buoys in Narragansett Bay and normalizing it to the keys on a piano using pentatonic scales. Each note represents the temperature averaged over a day, and the pitch from each of the different voicings is based on that temperature value. You can hear a difference from the winter data at the beginning of the clips and summer data towards the middle in both the overall pitch and how the buoy temperatures relate to one another.
