Visualizing objects in three dimensions significantly improves one’s ability to conceptualize the nature of the object. This is particularly important when studying microscopic objects such as molecules, viruses and cells. We can extend this functionality by visualizing 3D objects in a virtual world (virtual reality) or by superimposing the objects onto the real world (augmented reality). In addition to our bioinformatics services, the Core has expanded its mandate to include 3D visualization, molecular modeling, and VR/AR applications.
3D Visualization Services at URI
- RI-INBRE Core Visualization Lab
- Spartan molecular modeling licenses (2)
- Chimera/ChimeraX/Discovery Studio
- Vive VR headset
- Looking Glass holodisplay
- 3D Facility for Biomedical Sciences and 3D Printing (URI College of Pharmacy)
- Ernest Mario ‘63, ‘66 3D Visualization Auditorium (URI College of Pharmacy)
- URI Makerspace “_Space.URI” (University Libraries)
- URI Media and Technology Services (MTS)
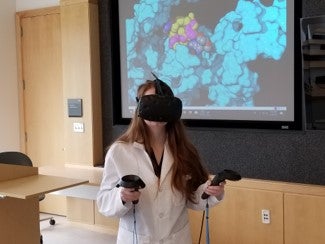
Virtual and Augmented Reality
Core maintains a Vive VR system purchased by the Department of Biomedical and Pharmaceutical Sciences at URI. This system is used to display in VR macro-molecules, medical images (MRI, CAT scan, etc.), confocal microscope images, and other 3D images. Please contact Chris Hemme for a demo (hemmecl@uri.edu).
Developing VR/AR Apps for Research and Education
Several faculty members in the College of Pharmacy are working with Roy Bergstrom at URI Media and Technology Services to develop VR and AR apps for integration into the Pharmacy curriculum. Below is a demo showing the history, clinical aspects and biochemistry of aspirin. If you are interested in developing VR or AR apps, please contact Chris Hemme (hemmecl@uri.edu).
Core Visualization and Modeling Lab
 Located in room 495Q in Avedisian Hall at URI, the RI-INBRE Bioinformatics Core Visualization and Modeling Lab provides resources for INBRE investigators for molecular modeling (Spartan), 3D visualization (Chimera, Discovery Studio, Looking Glass holodisplay), and VR/AR app development (Unity, Blender, Vuforia). Users can request access to use these resources by contacting Chris Hemme (hemmecl@uri.edu).
URI 3D Facility for Biomedical Sciences
The College of Pharmacy maintains a 3D facility for visualizing and printing 3D molecules and production of animation videos for teaching and research. Funded by the Champlin Foundation, the main objective of the 3D center is to make science visible in 3D, helping students clearly conceptualize, visualize and produce complex scientific ideas in 3D. For consultation and pricing, please contact Dr. Bongsup Cho (bcho@uri.edu).
Metrics Tracking for RI-INBRE
The RI-INBRE program has been in operation since 2001. This has resulted in an enormous amount of data regarding projects, investigators, mentors and students funded by the program. To better make sense of this information, we have deposited the data into a Neo4j graph database. Unlike a traditional relational database, a graph database stores the data as a graph with objects (e.g. People, Education, Mentorship) as nodes and relationships (e.g. EMPLOYED, CURRENT DEGREE, MENTOR) as edges. This allows rapid retrieval of the data and permits sophisticated data analysis and identification of trends.