Are Rhode Islanders Staying Home During the Covid-19 Pandemic?

By Michael DiNardi PhD, Department of Economics
State and local governments in the United States implemented a number of policies to promote social distancing to reduce the spread of COVID-19. Since March, Rhode Island took the following major actions:
- March 9: State of emergency declared
- March 13: Visitors to nursing homes banned
- March 16: K-12 schools and day cares closed
- March 17: Bars and dine-in restaurants closed; crowds of 25 or more banned
- March 23: Entertainment, recreation and personal services (salons, tattoo shops) closed
- March 28: Stay at home order
- April 18: Mandate use of face masks by customers and employees in essential businesses
In this post, I focus on two of these major actions: (1) the state of emergency declaration and (2) the stay at home order. The state of emergency declaration, while not an explicit policy restricting mobility, may affect social distancing through information or precautionary mechanisms, while the stay at home order is an explicit restriction on mobility by ordering people to stay at home except to acquire essentials.
How well are we doing at social distancing in Rhode Island? It’s important to note that social distancing is a simply an idea about limiting contact with others, not a specific variable that can be accurately measured. One way to get a sense of whether people are social distancing is to estimate how much time people spend at home.
To measure how much time Rhode Islanders are spending at home, I obtained aggregated anonymous mobile device GPS location data from two sources: SafeGraph Inc. and Google’s Community Mobility Reports. Since this data relies on mobile device location, it serves as a proxy and may not perfectly represent people’s actual physical location.
SafeGraph Inc. data
I use SafeGraph’s Social Distancing Metrics data[1] which are generated from GPS pings of anonymous mobile devices. I measure social distance as the percent of mobile devices that did not leave the home in each day. Because SafeGraph does not know the mobile device owner’s actual home location, they proxy for the home by using the mobile device’s common nighttime location in a 500 square-foot area over a 6-week period. This proxy has a few limitations. First, assuming the proxy location is accurate, people may maintain social distance while still leaving this 500 square-foot “home” location by, for example, going for short walks outside. Second, a small fraction of this measure likely captures nightshift workers because this metric is measured as the common nighttime location, although this fraction is likely declining over time given the pandemic’s large negative effect on employment. Finally, the pandemic may cause some people to temporarily move to (for example, those who live out-of-state but own vacation homes) or leave Rhode Island (for example, students returning to their parents’ home) which will cause changes to those users’ home locations.
The gray dots in the following graph show the social distancing measure calculated SafeGraph Inc.’s data – the percent of mobile devices that did not leave the home each day – from February 1, 2020 to May 7, 2020.
I also fit a linear trend in three periods: (1) before the emergency declaration (Feb. 1-March 8), (2) emergency declaration until the stay at home order (March 9-27), and (3) since the stay at home order (March 28-May 7).
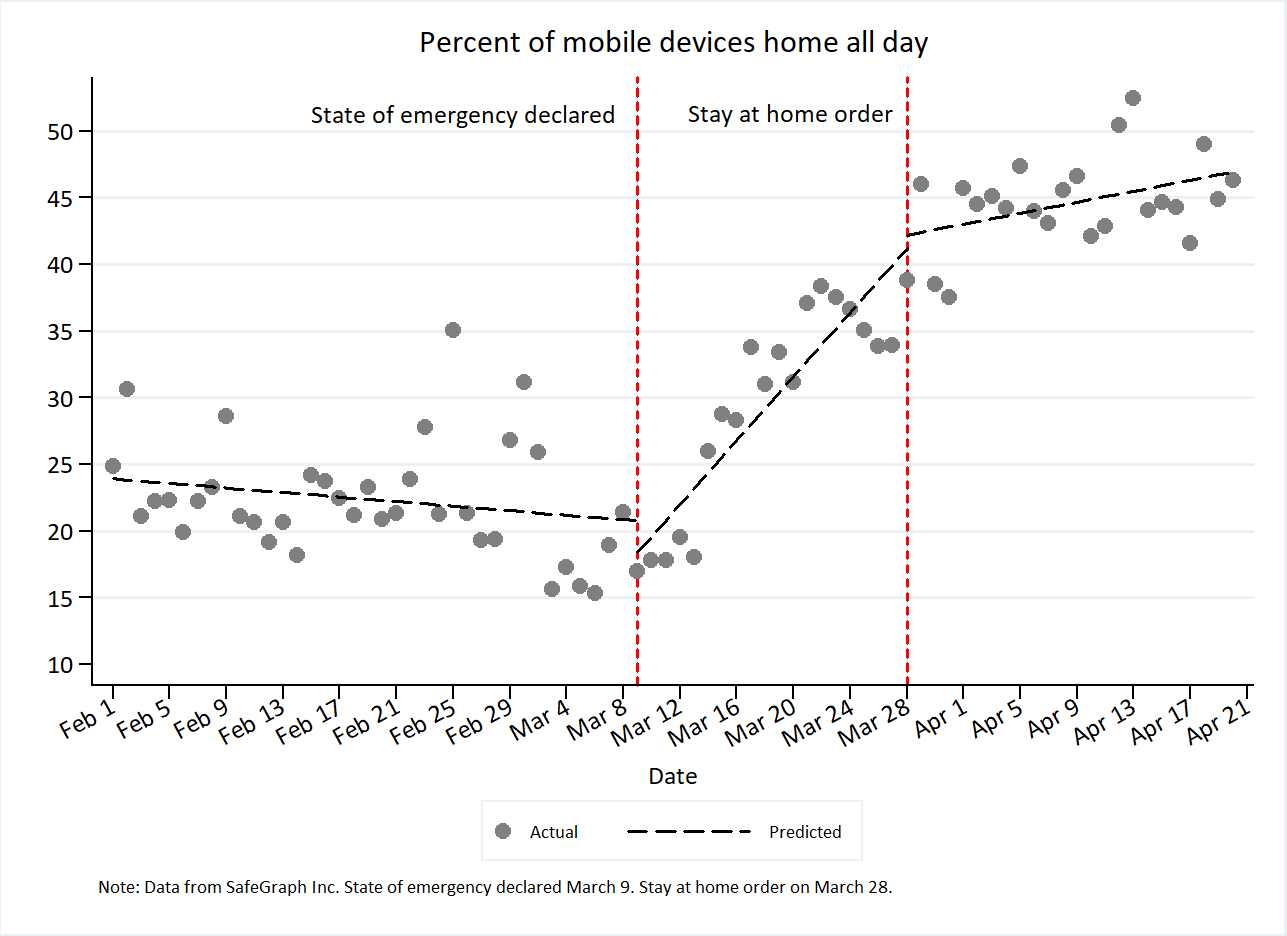
Prior to the state of emergency declaration, between 20 and 25 percent of mobile devices did not leave the home on a given day. The percent at home declined slightly in this period, likely due to slight warming temperatures through February into March. After the emergency declaration, there is a sharp increase in devices remaining at home, up to nearly 40 percent on the day prior to the stay at home order. After the stay at home order, there is a small jump, but the trend is flat around 45 percent.
Google Community Mobility Report data
Google’s Community Mobility Reports[2] are created from aggregated and anonymized data from users that opt-in to Google’s Location History service which tracks the GPS location of the mobile device. A major limitation of this data is that the patterns of users who opt-out of location tracking may differ from those who opt-in to tracking. Thus, this sample may not be representative of the population’s overall behavior. The metric to measure social distance in the Google data is the percent change in time spent in at a residential location, relative to the median value for the day of the week from the baseline 5-week period from January 3, 2020 to February 6, 2020.
The gray dots in the following graph show the percent change in time spent in a residential location relative to the median value from the day’s baseline period using Google’s data. Like the previous graph, I fit a linear trend in the period before the state of emergency declaration, between the emergency declaration and stay at home order, and after the stay at home order.
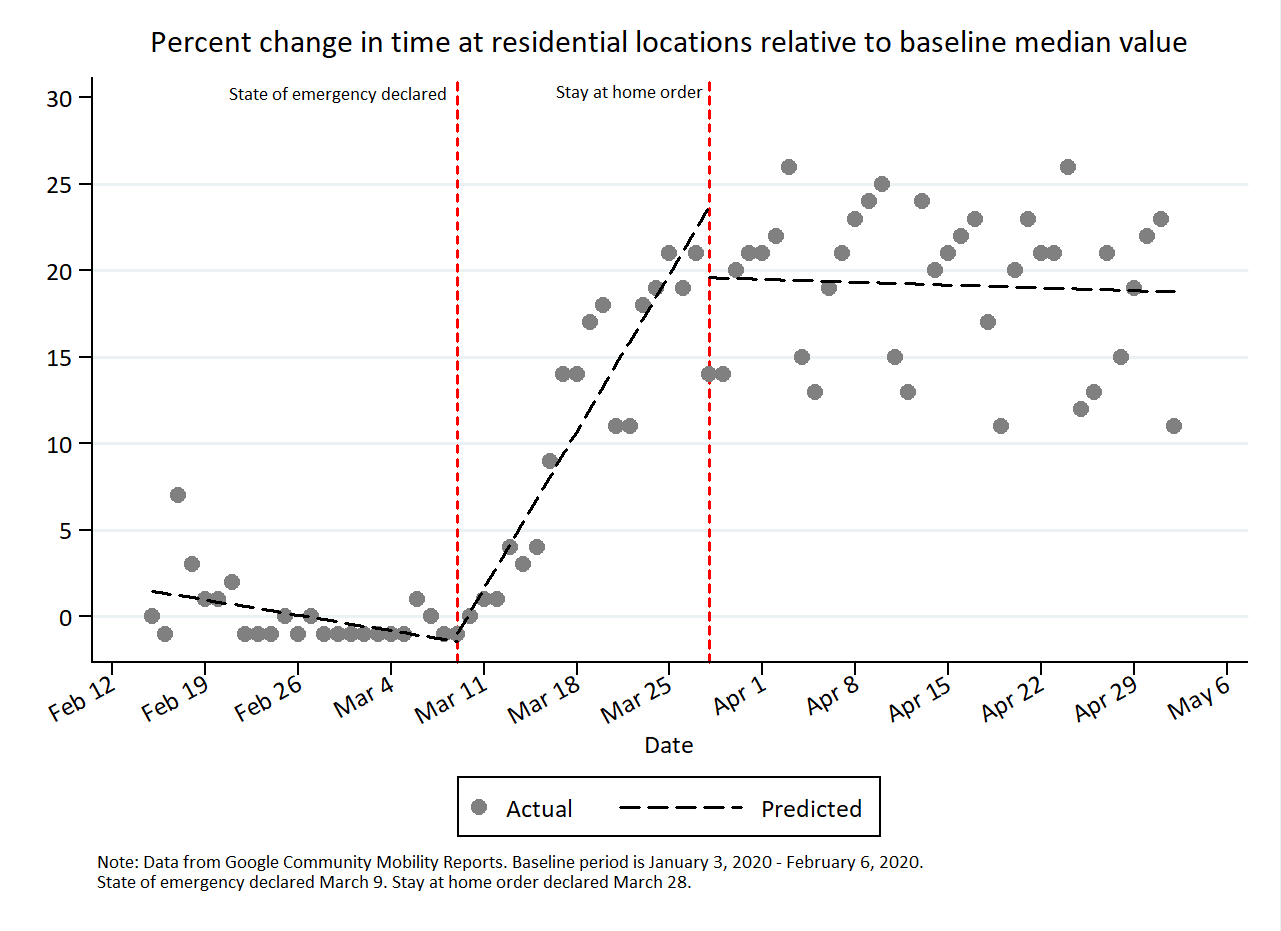
The pattern in the Google data is very similar to the SafeGraph data: a sharp rise in time spent at home for Google-tracked mobile devices after the state of emergency declaration that levels off after the stay at home order. Before the emergency declaration, people were spending slightly less time at home relative to the baseline. On the day before the stay at home order, people were spending about 20 percent more time at home relative baseline, and this percent change persisted after the stay at home order.
Summary
These results show a large increase in Rhode Islanders staying at home, with the trend beginning after the state of emergency declaration. This suggests the information mechanism had large effects on social distancing. However, in this analysis, it is impossible to tease out how much, if any, of the rise in staying at home is due to the emergency declaration versus other informational shocks (such as increased news reporting and presidential press briefings on the pandemic), employer-prescribed work from home mandates, or job losses that occurred in the period between the declaration and stay at home order.
How we should interpret the effectiveness of the stay at home order is difficult. Some may interpret this evidence as suggesting stay at home orders were unnecessary given that social distancing rose sharply prior to the order and leveled off after the order. On the other hand, stay at home orders help manage and coordinate individual expectations and behavior which reinforces social distancing.
As Rhode Island slowly begins to re-open, I expect people will continue social distancing practices as they remain cautious about the spread of the virus.
[1] Data from SafeGraph is provided for free to academics and others working on COVID-19 projects. A detailed description of the data is available at: https://docs.safegraph.com/docs/social-distancing-metrics
[2] Data and documentation from Google’s Community Mobility Reports is available at: https://www.google.com/covid19/mobility/