University of Rhode Island
Social Science Institute for Research, Education, and Policy
Dr. Yinjiao Ye
Research Associates: Caroline Morganelli, Maddie Marques, April Denn
web.uri.edu/ssirep/research/
Timeframe: October 2019 to April 2020
N: 37 Local news outlets, 832 news stories
Methodology in Brief: This analysis was funded by the Rhode Island Foundation and designed and analyzed by faculty at the Social Science Institute for Research, Education, and Policy (SSIREP) at the University of Rhode Island. It is part of a larger project on the state and local media landscape in Rhode Island that uses various methods to study how Rhode Islanders consume and interact with state and local media. The content analysis is one component of the larger project, and is intended to measure the content and representativeness of Rhode Island’s state and local media.
Professor of Communication Studies, Yinjiao Ye, and her research associates, Caroline Morganelli, Maddie Marques, and April Denn, conducted the content analysis. The team examined 37 local news outlets, including most of Rhode Island’s local newspapers and a selection of local TV and radio stations, magazines, media with special interests and college newspapers. A full list of news outlets included is located in the appendix A. Articles were randomly selected from all articles published between October 2019 and April 2020. For each newspaper, the team collected one composite week’s stories published on the front pages, resulting in approximately 20 stories from each newspaper. For magazines, media with special interests, TV channels, and radio stations, the team collected an equivalent number of stories (~20) from each media outlet. As a result, a total of 832 news stories from 37 local news organizations were included in the analysis.
The team coded each article for the topics it addressed (e.g. government and politics, arts and culture, etc.), the location of the topic covered, the gender, age, race and ethnicity, profession, and position of up to three people featured in the article. Gender was coded based on the person’s name as well as other text or image information available in the article (e.g., he or she used to refer to the person). Age, race and ethnicity, profession, and position were coded based on the text or image information provided in the article. The team also explored sentiments expressed toward the main characters or event featured in the article (see Appendix B).
Topics Represented
One of the primary purposes of local media since the founding of the United States has been to serve as a watchdog of democracy. Citizens need the local media to gather information about local and state government officials and other people in power so that citizens can be informed of government actions and hold their elected officials accountable. Another critical function of the local media is to keep the public informed of their community by delivering various types of information such as local cultural activities and events, information on local schools and crime, and coverage of environmental issues.
Our analysis found that in this regard, local media are serving their core purpose. The topics covered most frequently in the 832 news stories were government and politics (n = 216, 25.96%) and arts and culture (n = 222, 26.68%), followed by economic development (n = 150, 18.15%). Education (n = 100, 12.02%), health (n = 86, 10.34%) and law enforcement and public safety (n = 87, 10.46%) also received significant coverage.[1] One important thing to note is that because the articles contained stories from March and April of 2020, the beginning of COVID-19 pandemic, many of the health articles addressed COVID-19. Without the pandemic, health may have received less attention.
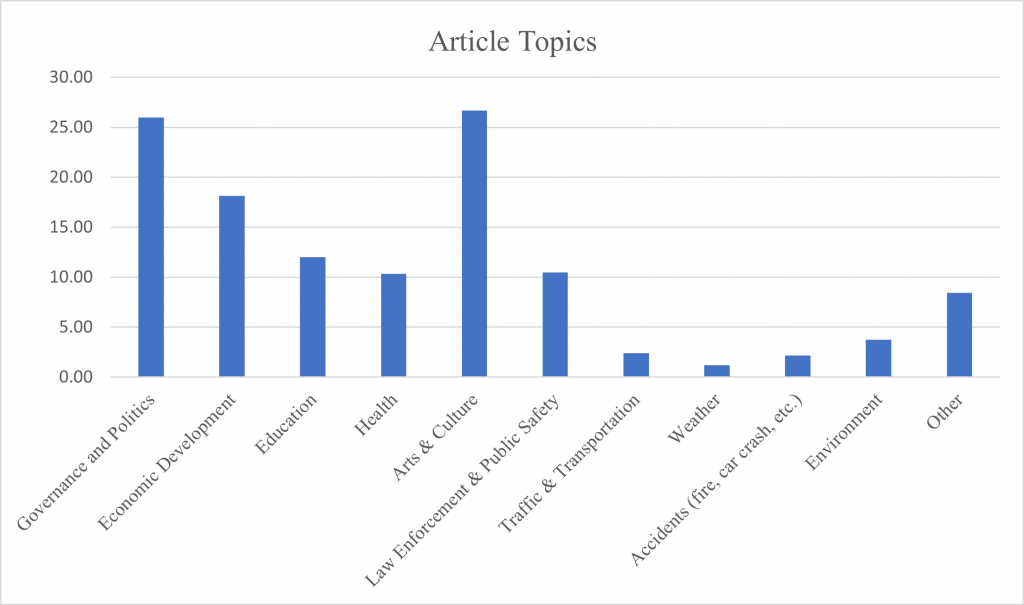
Figure 1. Topics covered in the 37 Rhode Island local media. The Y-axis represents the percentage of articles that cover each topic.
A breakdown of the topics by media type is shown in Table 1. For local newspapers, the top three most frequently covered topics were government and politics, arts and culture, and economic development. For magazines, the most frequently covered topic was arts and culture (66% of the sampled articles), which may be due to their longer publishing cycles, making breaking news in government and politics less fitting for these publications. For TV, radio and wire news outlets, the most frequently covered topic was law enforcement and public safety, followed by arts and culture and government and politics. The focus on law enforcement and crime over government and politics compared to the local papers is interesting and worth further analysis. For the two special interest media outlets, the top three topics were arts and culture, law enforcement and public safety, and government and politics, similar to TV, radio and wire news outlets. For college newspapers, the top three topics were arts and culture, education, and government and politics. About 16% of articles from the college newspapers were about education, reflecting the nature of the audience.
Table 1. Coverage of Different Topics by Media Type
|
Topics |
Media Type | |||||||
| Local
Newspapers |
Magazines | Special Interests | TV, Radio,
& Wire |
College Newspapers | Total | |||
| Government & Politics | 173(31.34%) | 3 (6.38%) | 11(19.64%) | 22 (17.32%) | 7(14.00%) | 216(25.96%) | ||
| Economic Development | 125(22.64%) | 6 (12.77%) | 5 (8.93%) | 11 (8.66%) | 3(6.00%) | 150 (18.03%) | ||
| Education | 76(13.77%) | 0 (0.00%) | 3 (5.36%) | 13 (10.24%) | 8(16.00%) | 100 (12.02%) | ||
| Health | 58(10.51%) | 4 (8.51%) | 10 (17.86%) | 12 (9.45%) | 2(4.00%) | 86 (10.34%) | ||
| Arts & Culture | 133(24.09%) | 31 (65.96%) | 16 (28.57%) | 25 (19.69%) | 17(34.00%) | 222(26.68%) | ||
| Law Enforcement & Public Safety | 30(5.43%) | 2 (4.26%) | 13(23.21%) | 38 (29.92%) | 4(8.00%) | 87(10.46%) | ||
| Traffic & Transportation | 20(3.62%) | 0 (0.00%) | 0 (0.00%) | 1 (0.79%) | 0(0.00%) | 21(2.52%) | ||
| Weather | 9(1.63%) | 0 (0.00%) | 0 (0.00%) | 1 (0.79%) | 0(0.00%) | 10(1.20%) | ||
| Accidents (fire, car crash, etc.) | 7(1.27%) | 0 (0.00%) | 4 (7.14%) | 7 (5.51%) | 0(0.00%) | 18(2.16%) | ||
| Environment | 25(4.53%) | 1 (2.13%) | 1 (1.79%) | 3 (2.36%) | 2(4.00%) | 32(3.85%) | ||
| Other | 33(5.98%) | 8 (17.02%) | 6 (10.71%) | 12 (9.45%) | 11(22.00%) | 70(8.41%) | ||
| Total # of articles in the sample | 552 | 47 | 56 | 127 | 50 | 832 | ||
Notes: We coded each article for one or more topics (based on how many were presented), therefore the percentages in each column add up to over 100%.
Most of the events covered in the local news occurred locally (n = 583, 70%) or statewide (n = 133, 16%). National events occurring outside of Rhode Island received much less attention (n = 97, 12%). International events received a negligible amount of coverage (n = 19, 2%). This demonstrates again that the information provided by the local media in Rhode Island is not available from media outlets elsewhere and the topics are locally oriented.
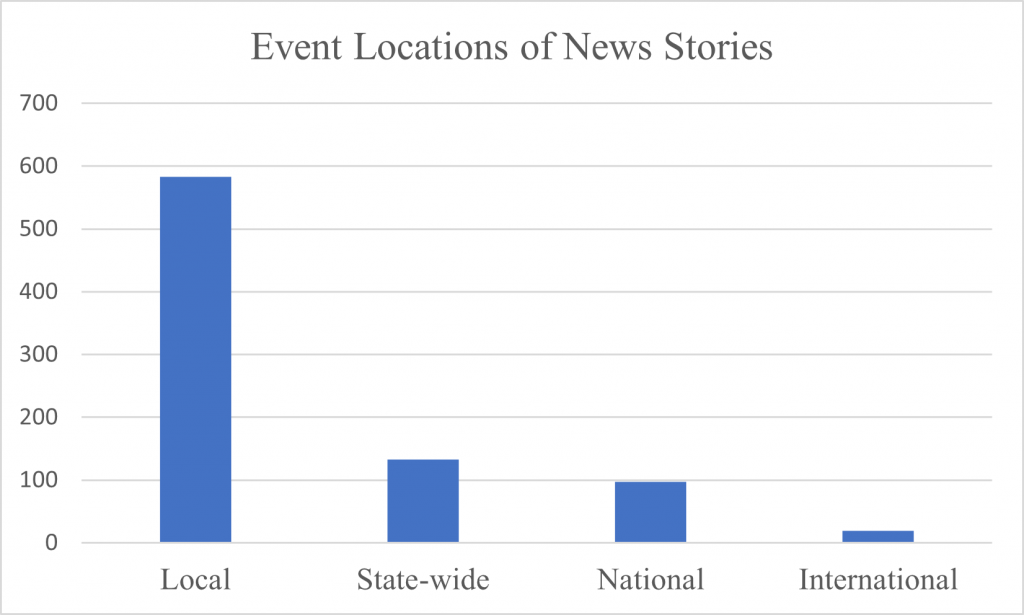
Figure 2. Event locations of the news stories covered in Rhode Island’s local media. The Y-axis represents the number of articles.
Diversity of Representation in the Media
Our analysis found a male-bias in local media representation. Approximately 63% (n = 1,234) of people referenced in state and local news stories had traditionally male names or were referred to as “he,” and only 37% (n = 723) had traditionally female names or were referred to as “she.” These numbers indicate a large gender imbalance in news representation of the sexes in Rhode Island given 51.3% of Rhode Islanders are female according to the U.S. Census.[2]
We also found a discrepancy between the race and ethnic makeup of the state and the racial and ethnic makeup of the people featured in local news, however the bias was not as drastic as in the case of gender. According to the U.S. Census, the population of Rhode Island is 71.4% non-Hispanic White, 16% Hispanic, 9% Non-Hispanic Black, and 5% Asian or other races. We were able to identify the race or ethnicity of 619 of the people mentioned in our news sample. Of those, 81% were White (n = 457), 7% (n = 41) were Black, 7% (n = 39) were Hispanic, and 5% (n = 29) were Asian or another race or ethnicity. The numbers remain basically the same if we exclude the two special interest media outlets (i.e., Providence en Espanol and Jewish Rhode Island). Race and ethnicity were the most difficult to verify and therefore only about a third of the sample is coded for race/ethnicity, however, we do not think the uncoded portion would be significantly different from those we were able to code.
Table 2. Demographics of People Represented in the Local Media
| Sex | Number of People (Valid %)
(Total N = 2,006) |
% in R.I.
(if available) |
Difference in % |
| Male | 1,234 (63.06%) | 48.70% | +14.36% |
| Female | 723 (36.94%) | 51.30% | -14.36% |
| Unknown | 49 | ||
| Age | |||
| Younger than 18 years old | 107 (15.51%) | 24.40% | -8.89% |
| 18-29 | 135 (17.77%) | ||
| 30-49 | 257 (32.76%) | ||
| 50-69 | 168 (23.74%) | ||
| 70 or older | 58 (10.21%) | ||
| Unknown | 1281 | ||
| Race and Ethnicity | |||
| Non-Hispanic White | 457 (80.74%) | 71.40% | +9.34% |
| Non-Hispanic Black | 41 (7.24%) | 8.50% | -1.26% |
| Hispanic | 39 (6.89%) | 16.30% | -9.41% |
| Asian, Pacific Islander, American Indian, or Alaska Native | 19 (3.36%) | 5.00%* | |
| Other | 10 (1.77%) | ||
| Unknown | 1440 |
Note: The number of unknown cases is not included in the calculation of the percentages.
*The percentage 5% in the census data includes Asian, American Indian, Alaska Native, Native Hawaiian and other races/ethnicities.
We also coded for the types of professions/descriptions of the people featured in the local news. Government officials (36%), many of which were state and local government officials, was overwhelmingly the most common profession featured in the local news. Educators (9.35%), students (9.41%), and law enforcement professionals (6.61%) were the next three most frequent professions.
Table 3. Professions Represented in the Local Media
| Profession | Frequency | Percent |
| Artist or Entertainer | 58 | 3.45% |
| Educator | 157 | 9.35% |
| Engineer | 3 | 0.18% |
| Financial service professional | 16 | 0.95% |
| Government official | 604 | 35.97% |
| Healthcare professional | 38 | 2.26% |
| Law enforcement professional | 111 | 6.61% |
| Lawyer, judge, or other legal service professional | 47 | 2.80% |
| Retired/unemployed/homemaker | 24 | 1.43% |
| Self-employed or freelance | 102 | 6.08% |
| Student | 158 | 9.41% |
| Other profession (e.g., spokesperson, coach, journalist) | 361 | 21.50% |
| Retired/unemployed/homemaker | 24 | 1.43% |
| Self-employed or freelance | 102 | 6.08% |
| Student | 158 | 9.41% |
| Subtotal | 1,679 | 100% |
| Unknown | 326 | |
| Total | 2,006 |
The distribution of professions among males was significantly different from that among females (see Table 4). While women were featured less in news overall, we found that the percentages of men featured in their roles as educators, governmental officials and financial service professionals were about the same as that for women featured in these roles. However, males were four times more likely to be featured in their role as law enforcement officers than females and two times more likely to be featured in their role as legal service professionals than females. In contrast, females were two times more likely to be featured in their role as healthcare professionals.
Table 4. Professions Represented in the Local Media by Gender
| Profession | Gender | Total | ||
| Male | Female | Unknown | ||
| Artist or Entertainer | 40(3.77%) | 18(3.08%) | 0(0.00%) | 58 (3.45%) |
| Educator | 103(9.71%) | 54(9.25%) | 0(0.00%) | 157 (9.35%) |
| Engineer | 3(0.28%) | 0 (0.00%) | 0(0.00%) | 3 (0.18%) |
| Financial service professional | 10(0.94%) | 6 (1.03%) | 0(0.00%) | 16 (0.95%) |
| Government official | 385(36.29%) | 211 (36.13%) | 8 (22.86%) | 604 (35.95%) |
| Healthcare professional | 16(1.51%) | 19 (3.25%) | 3 (8.57%) | 38 (2.26%) |
| Law enforcement professional | 93(8.77%) | 12 (2.05%) | 6 (17.14%) | 111 (6.61%) |
| Lawyer, judge, or other legal service professional | 35(3.30%) | 10 (1.71%) | 2 (5.71%) | 47 (2.80%) |
| Retired/unemployed/homemaker | 16(1.51%) | 8 (1.37%) | 0(0.00%) | 24 (1.43%) |
| Self-employed or freelance | 72(6.79%) | 29 (4.97%) | 1 (2.86%) | 102 (6.07%) |
| Student | 69(6.50%) | 86 (14.73%) | 3 (8.57%) | 158 (9.40%) |
| Other profession (e.g., spokesperson, coach) | 219(20.64%) | 131 (22.43%) | 12(34.29%) | 362 (21.55%) |
| Subtotal | 1,061(100%) | 584 (100%) | 35(100%) | 1,680 (100%) |
| Unknown | 173 | 139 | 14 | 326 |
| Total | 1234 | 723 | 49 | 2006 |
The distribution of professions across different racial groups differed significantly (Table 5). For example, non-Hispanic Whites were approximately three times more likely to be featured as educators than Hispanics, and approximately two times more likely than Hispanics and four times more likely than non-Hispanic Blacks to be featured as governmental officials. Relatively speaking, racial minorities appeared more frequently in the categories of artists and entertainers, students, and law enforcement professionals.
Table 5. Professions Represented in the Local Media by Race and Ethnicity
| Profession | Race/Ethnicity | Total | |||||
| Non-Hispanic
White |
Non-Hispanic
Black
|
Hispanic | Asian | Other | Unknown | ||
| Artist or Entertainer | 23(6.13%) | 0(0.00%) | 5(19.23%) | 0(0.00%) | 0(0.00%) | 30 (2.46%) | 58(3.45%) |
| Educator | 35(9.33%) | 7(21.21%) | 1(3.85%) | 2(11.11%) | 0(0.00%) | 112(9.18%) | 157(9.35%) |
| Engineer | 1(0.27%) | 0(0.00%) | 0(0.00%) | 0(0.00%) | 0(0.00%) | 2(0.16%) | 3(0.18%) |
| Financial service professional | 1(0.27%) | 0(0.00% | 0(0.00%) | 0(0.00%) | 0(0.00%) | 15(1.23%) | 16(0.95%) |
| Government official | 106(28.27%) | 2(6.06%) | 4(15.38%) | 3(16.67%) | 0(25.00%) | 487(39.92%) | 604(35.95%) |
| Healthcare professional | 8(2.13%) | 0(0.00%) | 0(0.00%) | 2(11.11%) | 0(0.00%) | 28(2.30%) | 38(2.26%) |
| Law enforcement professional | 28(7.47%) | 3(9.09%) | 5(19.23%) | 0(0.00%) | 0(0.00%) | 75(6.15%) | 111(6.61%) |
| Legal service professional | 3(0.80%) | 2(6.06%) | 0(0.00%) | 0(0.00%) | 1(12.50%) | 41(3.36%) | 47(2.80%) |
| Retired/unemployed/homemaker | 9(2.40%) | 1(3.03%) | 0(0.00%) | 0(0.00%) | 0(0.00%) | 14(22.30%) | 24(1.43%) |
| Self-employed or freelance | 36(9.60%) | 0(0.00%) | 1(3.85%) | 0(0.00%) | 2(25.00%) | 63(1.15%) | 102(6.07%) |
| Student | 50(13.33%) | 12(6.36%) | 5(19.23%) | 9(50.00%) | 1(12.50%) | 81(5.16%) | 158(9.40%) |
| Other (e.g., spokesperson, coach) | 75(20.00%) | 6(18.18%) | 5(19.23%) | 2(11.11%) | 2(25.00%) | 272(6.64%) | 362(21.55%) |
| Subtotal | 375(100%) | 33(100%) | 26(100%) | 18(100%) | 8(100%) | 1220(100%) | 1680(100%) |
| Unknown | 82 | 8 | 13 | 1 | 2 | 220 | 326 |
| Total | 457 | 41 | 39 | 19 | 10 | 1440 | 2006 |
Note: The category of Asian includes Asian, American Indian, Alaska Native, Native Hawaiian and other Pacific Islander.
The local media also covered special groups of people, such as people of color, people with low incomes or living in poverty, homeless persons, people with illicit drug dependency, people with mental health problems, veterans, members of the LGBT community, and the elderly (Figure 3). About 12% (n = 99) of the sampled articles mentioned or were devoted to these issues or vulnerable groups of people. The most frequently covered special group was those with low-incomes, in poverty, or homeless people, followed by people with mental health or other significant health problems.
Further examination of these groups of people reveals that veterans were often covered in articles pertaining to issues of PTSD, Veterans Day ceremonies, in which local communities honored veterans, or for personal accounts of their experiences in service. For example, an article entitled “East Greenwich completes ‘Purple Heart Highway’” from the East Greenwich Pendulum discussed that a record number of veterans likely suffer from PTSD, depression and suicidal thoughts.
People of color were more frequently mentioned or interviewed in stories that featured topics like teacher and student diversity in education, and education bills that allocate more money to low-income districts and communities of color. Stories most commonly featured low-income people when addressing education and holiday giving. Several articles about COVID-19 discussed low-income and vulnerable groups of people hit hard by the pandemic. Immigrants received attention in a wider variety of stories and in a variety of ways. For example, in the sample, immigrants were featured in their roles as local business owners, employees in grocery stores, farm workers, and students affected by the pandemic.
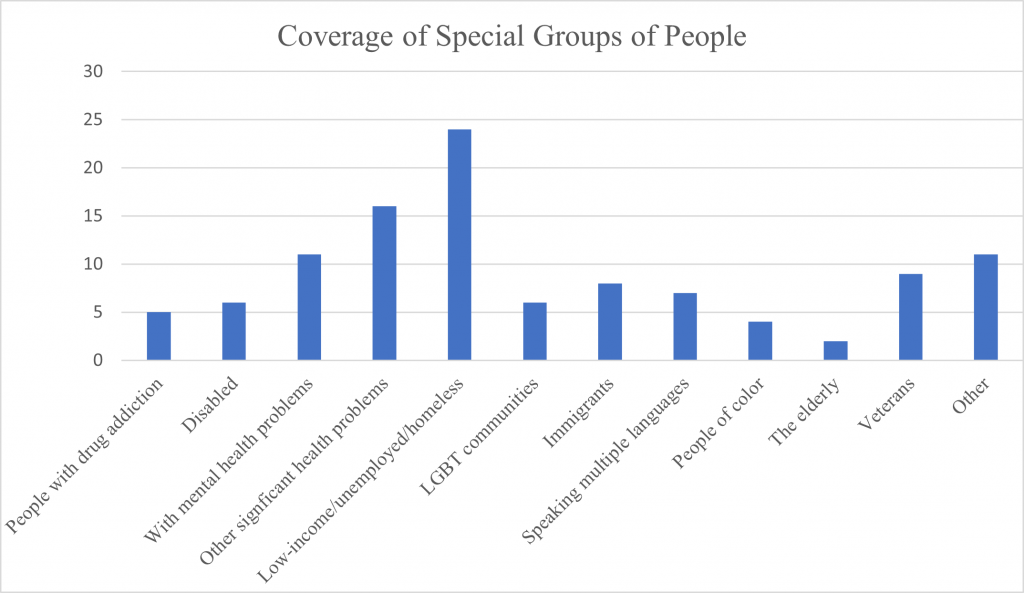
Figure 3. Special groups of people covered in Rhode Island local media. The Y-axis represents the number of articles.
Voices, Perspectives, and Sentiments Represented
In the sample, different opinions, voices and sentiments (positive, negative, or neutral) were reported in the stories (see Table 6). The majority of the articles (650 out of 832 articles, 78%) contained a mixed or neutral view of the featured event or person. For example, in a report of the compensation package of Bryant University’s president Ron Machtley, both positive and negative sentiments were expressed through different people interviewed in the story. A negative sentiment was from a professor at George Mason University in Virginia who said, “It’s hard to imagine how a private university, while well ranked as a northern regional university … can or should provide such as lucrative compensation package to its president, regardless of his long service.” A positive sentiment was from chair of the board William Conaty: “Looking back over the past 15 years, this initial investment by the university has proven to be one of the best decisions Bryant ever made.” Another example is an article entitled “Wisconsin Guard leader resigns in wake of sex assault review.” The news article not only reports the leader’s wrongdoings and the National Guard’s misconduct but also recognizes the leader’s past positive record. Another example is an article from Barrington Times entitled “Saving Graduation” in which three students were featured, each with a different opinion on virtual graduation ceremonies. They had mixed opinions toward Governor Gina Raimondo’s decision to go online: they understood the decision but they also expressed that they hoped to have a face-to-face graduation ceremony.
Further examination of the perspectives and sentiments used in the local media shows that in each topic neutral sentiments were featured overwhelmingly and both positive and negative perspectives and sentiments were present. Positive sentiments were more common in news about arts and culture, whereas negative sentiments were more frequent in law enforcement and public safety. For government and politics, the frequencies of positive sentiments and negative sentiments were almost equal.
Table 6. Sentiments in Various Topics in the Local Media
| Topics | Sentiment | Total | ||
| Positive
sentiment |
Negative
sentiment |
Neutral
sentiment |
||
| Government & Politics | 78 (24.15%) | 66 (20.43%) | 179 (55.42%) | 323 (100%) |
| Economic Development | 67 (30.18%) | 36 (16.22%) | 119 (53.60%) | 222 (100%) |
| Education | 58 (36.71%) | 18 (11.39%) | 82 (51.90%) | 158 (100%) |
| Health | 38 (33.63%) | 10 (8.85%) | 65 (57.52%) | 113 (100%) |
| Arts & Culture | 146 (47.25%) | 15 (4.85%) | 148 (47.90%) | 309 (100%) |
| Law Enforcement & Public Safety | 13 (10.40%) | 40 (32.00%) | 72 (57.60%) | 125 (100%) |
| Traffic & Transportation | 5 (18.52%) | 2 (7.41%) | 20 (74.07%) | 27 (100%) |
| Weather | 2 (18.18%) | 0 (0.00%) | 9 (81.82%) | 11 (100%) |
| Accidents (fire, car crash, etc.) | 4 (21.05%) | 0 (0.00%) | 15 (78.95%) | 19 (100%) |
| Environment | 12 (28.57%) | 4 (9.52%) | 26 (61.90%) | 42 (100%) |
| Other | 38 (34.23%) | 18 (16.22%) | 55 (49.55%) | 111 (100%) |
Note: We coded each article for one or more sentiments when applicable.
The voices and opinions of different groups of people were represented in the local news media, including governmental officials, representatives of community groups, and community members (see Table 7). Both public officials (n = 853, 41%) and community members (n = 827, 43%) were featured most frequently. Representatives of community groups (e.g., representatives of companies and non-profit organizations) received less coverage (n = 326, 16%). Overall, each group had a significant position in the local news reporting. For instance, in an article entitled “HTC mulls removing board chairman over solar stance”, both the Planning Board chairperson Alfred DiOrio and Town Solicitor Kevin McAllister’s perspectives were presented, and council members and residents’ were also featured. The emphasis on voices from residents can also be seen in another article entitled “Future Pizzaiolos” from Newport This Week, which depicts a chef sharing his culinary gifts with children. This article was centered in the prominent position of the front page (although the position of the article is not analyzed in this project), and there are many other articles like this that depict residents lives.
Table 7. Positions of People Represented in the Local Media
| Frequency | Percent | |
| Position | ||
| Community member | 827 | 41.2 |
| Public official | 853 | 42.5 |
| Representative of a community group | 326 | 16.3 |
| Total | 2006 | 100 |
The distribution of positions varies depending on media type. As shown in Table 8, local newspapers and TV and radio stations featured similar types of people at similar rates: public officials and community members appeared more frequently than community representatives. However, magazines and special interest media outlets featured more community members than newspapers and TV and radio news outlets, and college newspapers were more community oriented, featuring significantly more community representatives and community members. There is a caveat in the interpretation of these results: the sample included 26 local newspapers but only 2-5 media outlets each were included in the sample for college newspapers, magazines, special interests, and TV and radio stations.
Table 8. Positions of People Represented in the Local Media by Media Type
| Media Type | Position | Total | ||
| Public
official |
Community
representative |
Community
member |
||
| College Newspapers | 10(7.09%) | 64(45.39%) | 67(47.52%) | 141(100%) |
| Local Newspapers | 692(50.25%) | 178(12.93%) | 507(36.82%) | 1377(100%) |
| Magazines | 11(11.58%) | 18(18.95%) | 66(69.47%) | 95(100%) |
| Special Interests | 22(19.47%) | 29(25.66%) | 62(54.87%) | 113(100%) |
| TV, Radio & Wire | 118(42.14%) | 37(13.21%) | 125(44.64%) | 280(100%) |
| Total | 853 | 326 | 827 | 2006 |
The distribution of positions varied by gender, race, and ethnicity as well. Table 9 makes clear that while men received more coverage in general than women, those men featured were also much more likely to be public officials (47% of men featured) than community members (only 36% of men featured), whereas community members were by far the most common women featured (50%). Of the women featured in stories, only 36% of them were public officials. This is somewhat surprising given the high-ranking women in office in Rhode Island, including the Governor, Secretary of State, Director of the Department of Health, and many state Senators and state Legislators of high rank.
Table 9. Positions of People Represented in the Local Media by Gender
| Position | ||||
| Gender | Public official | Community Representative | Community member | Total |
| Male | 578 (46.84%) | 209 (16.94%) | 447 (36.22%) | 1234(100%) |
| Female | 259 (35.82%) | 106 (14.66%) | 358 (49.52%) | 723(100%) |
| Unknown | 16 (32.65%) | 11 (22.45%) | 22 (44.90%) | 49(100%) |
| Total | 853 (42.52%) | 326 (16.25%) | 827 (41.23%) | 2006(100%) |
Table 10 shows the distribution of position along race and ethnicity. Again, we see differences in presentation by race and ethnicity. Approximately 70% of Hispanics and Asians were community members but only 16% to 28% of them were public officials; in contrast, 55% of non-Hispanic Whites were community members but 33% were public officials. However, while the news featured White Rhode Islanders in stories far more often than Black Rhode Islanders, their likelihood of being featured in their roles as community member, public official, and community representative was almost identical.
Table 10. Positions of People Represented in the Local Media by Race/Ethnicity
| Race/Ethnicity | Position | Total | ||
| Public
official |
Community representative | Community member | ||
| Non-Hispanic White | 153(33.48%) | 51 (11.16%) | 253 (55.36%) | 457 (100%) |
| Non-Hispanic Black | 13 (31.71%) | 6 (14.63%) | 22 (53.66%) | 41 (100%) |
| Hispanic | 11 (28.21%) | 1 (2.56%) | 27 (69.23%) | 39 (100%) |
| Asian | 3 (15.79%) | 2 (10.53%) | 14 (73.68%) | 19 (100%) |
| Other | 2 (20.00%) | 2 (20.00%) | 6 (60.00%) | 10 (100%) |
| Unknown | 671 (46.60%) | 264 (18.33%) | 505 (35.07%) | 1440 (100%) |
| Total | 853 | 326 | 827 | 2006 |
Note: The category of Asian includes Asian, American Indian, Alaska Native, Native Hawaiian and other Pacific Islander.
Conclusions
The local news media cover a variety of topics and the most common topics are government and politics, arts and culture, and economic development. Our findings suggest the local news media mainly focus on local and state topics, and do not replicate the coverage of national news outlets.
We found the presence of a variety of demographic groups present in the articles we researched; however, non-Hispanic White men were overrepresented whereas women and Hispanics were underrepresented in the news. Approximately one in every 10 local news stories covered vulnerable groups, impoverished residents, seniors, veterans, people of color and people with mental health or drug addiction problems.
Although the local media covered a variety of professions, some gender and racial biases were clear, such as men were more likely to be featured in roles as public officials and law enforcement professionals.
The local news media generally presented the voices of both those in opposition and in favor of the issue at hand and represent various voices and opinions from the community. Governmental officials, community groups’ representatives, and community members were all featured in the news coverage, with community members and public officials receiving the most attention. Again, some gender and racial biases were present. For example, women were more likely to be featured as community members and racial minorities were more likely to be featured as community members.
Appendix A: List of 37 Sampled Rhode Island Local News Outlets
| College Newspapers |
| 1. Brown Daily Heralds (Brown) |
| 2. Good 5 Cent Cigar (URI) |
| Magazines |
| 3. Providence Monthly |
| 4. Rhode Island Monthly |
| Newspapers |
| 5. Barrington Times |
| 6. Block Island Times |
| 7. Bristol Phoenix |
| 8. Chariho Times |
| 9. Coventry Courier |
| 10. East Greenwich Pendulum |
| 11. Fall River Herald News |
| 12. Jamestown Press |
| 13. Kent County Daily Times |
| 14. Newport Daily News |
| 15. Newport This Week |
| 16. North Kingstown Standard Times |
| 17. Providence Business News |
| 18. Portsmouth Times |
| 19. Providence Journal |
| 20. Sakonnet Times |
| 21. The Narragansett Times |
| 22. The Pawtucket Times |
| 23. The Valley Breeze Cumberland |
| 24. The Valley Breeze North Providence |
| 25. The Valley Breeze Observer |
| 26. The Valley Breeze Woonsocket |
| 27. The Valley Breeze Pawtucket |
| 28. Warren Times-Gazzette |
| 29. Westerly Sun |
| 30. Woonsocket Call |
| Special Interest |
| 31. Providence En Spanol |
| 32. Jewish Rhode Island |
| TV, Radio, & Wire |
| 33. ABC-6 |
| 34. Associated Press Statewire |
| 35. RIPR |
| 36. WJAR |
| 37. WPRI |
Appendix B: Coding Sheet
- Article title and publication date
- Special groups of people (check all that apply)
- People with drug addiction
- Disabled
- People with mental health problems
- People with other significant health problems
- Low-income, unemployed, or homeless
- LGBT communities
- Immigrants
- People who speak two or more languages
- People of color
- The elderly
- Veterans
- Other
- Topic of Article
- Government and politics
- Economic development
- Education
- Health
- Arts & Culture
- Law enforcement and public safety
- Traffic and transportation
- Weather
- Accidents (fire, car crash, drowning, etc.)
- Environment
- Other
- Event location
- Local
- State
- National
- International or other (e.g., online)
- Age
- Younger than 18 years
- 18-29
- 30-49
- 50-69
- 70 and above
- Unknown
- Sex
- Male
- Female
- Unknown
- Race/Ethnicity
- Non-Hispanic White
- Non-Hispanic Black
- Hispanic
- Asian, American Indian, Alaska Native, Native Hawaiian and other Pacific Islander
- Other
- Unknown
- Profession
- Educator
- Healthcare professional (e.g., doctor, nurse, dentist, )
- Legal service professional (e.g., lawyer, judge)
- Engineer
- Accountant, banker, or other financial service professional
- Law enforcement professional
- Self-employed or freelance
- Student
- Artist or entertainer
- Retired, unemployed or homemaker
- Government official
- Other occupation
- Unknown
- Position
- Public official (e.g., state governor, town managers, town council members)
- Representative of a community group (e.g., a representative from an advocacy group, teachers union, parent-teacher association, Chamber of Commerce)
- Community member (e.g., residents)
- Sentiment represented toward main characters or main event (check all that apply)
- Positive
- Negative
- Mixed/Neutral
[1] Percent totals add up to over 100 because articles some articles contained more than one topic..
[2] https://www.census.gov/quickfacts/RI