University of Rhode Island Social Science Institute for Research, Education, and Policy
Principle Investigator: Dr. Shanna Pearson-Merkowitz
Research Associates: Kristin Sodhi and Travis Doumaney
Web: uri.edu/ssirep/research/
Field Dates May 14, 2020 – May 26, 2020
N=600 Rhode Island Residents
Adjusted Margin of Error: +/- 4.78
Rhode Islanders report that they follow the news fairly closely, enjoy keeping up with the news, and are satisfied by their access to information.
Rhode Islanders report being very interested in keeping up with the news: 47% say they enjoy keeping up “a lot.” However, age and income are associated with interest. Wealthier and older individuals have more interest in the news than younger and less wealthy respondents. A large majority (60%) of Rhode Islanders also say they follow state and local news closely most of the time regardless of whether something important is happening. Again, these numbers are highest among wealthier and older individuals. There were also clear racial divides: non-Hispanic White respondents were far more likely (63%) to follow state and local news most of the time, whereas far more Hispanic (53%) and Non-White (45%) respondents said they follow state and local news closely only when something important is happening. This can be a challenge for local news to meet their needs, since non-White Rhode Islanders appear not only to be a smaller share of the population but are also less likely to be regular viewers/readers.
An overwhelming 94% of Rhode Islanders surveyed said it was either easy (59%) or somewhat easy (34%) to find out what’s happening in Rhode Island. However, many fewer Rhode Islanders felt it was “very easy” (only 39%) to find out what was happening in their local community, while only 17% said it was either somewhat (14%) or very (3%) difficult to find out what was happening. There were no noticeable differences between groups in terms of access to information about the state. For local information, young (under age 30) and non-White respondents both were more likely to say it was somewhat or very hard to find information about what is happening in their local community.
A large percentage of Rhode Islanders (79%) also say that the state and local news media do either very well (21%) or somewhat well (58%) at providing the information that people like them need to know. However, those under 30 are the least likely to choose “very well” (11%) and the group most likely to choose “not well at all” (6%). Interestingly, again, it is those with the highest incomes that are the most likely to have a negative view of how well the media do at providing the information they need (27% saying either not very well or not well at all). It is also those over the age of 60 that are the most likely to have a positive view (29% said “very well” and 58% said “somewhat well”). Likewise, respondents had a largely positive view of how well the media do at providing the information that people like them are interested in, but only 14% said the state and local news do “very well” at providing such news. Far more (56%) said the media do only “somewhat well.” The groups that rated the state and local media most highly in terms of providing stories that are of interest to them were those over 60 (20% saying “very well”) and Hispanic respondents (23% saying “very well”).
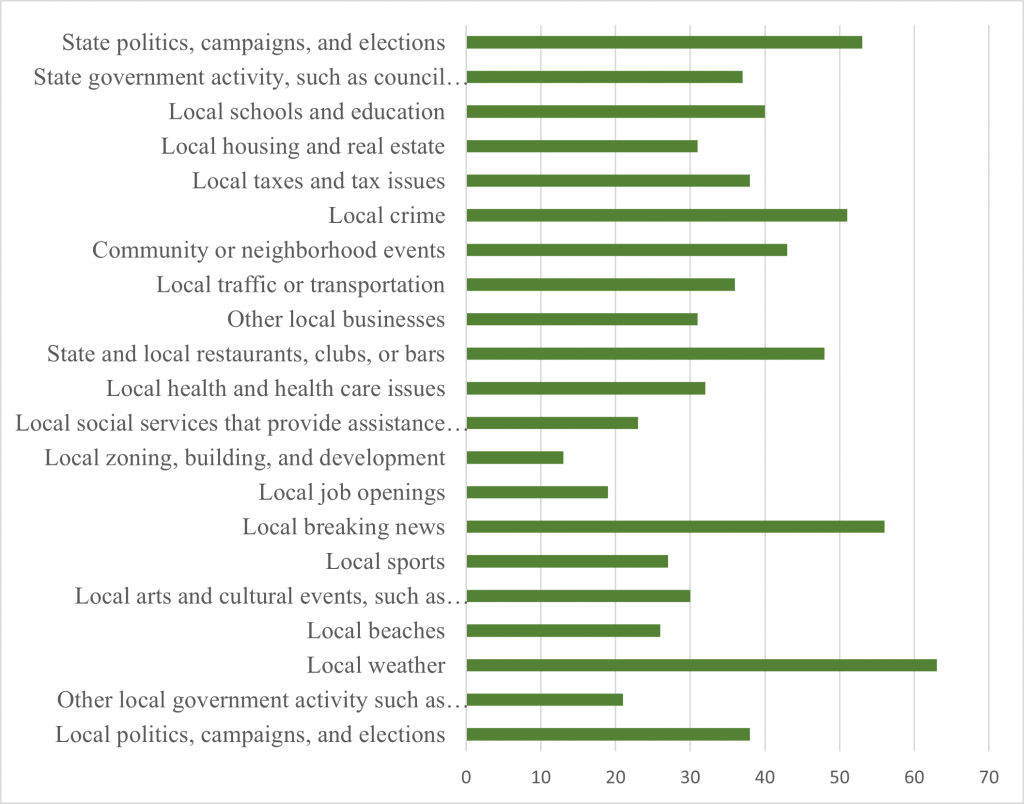
Rhode Islanders’ overall positive view of how well the media do at providing information they want changes slightly when they are asked specifically about what kinds of information they look for and if that specific information is easy or hard to find. We first asked what type of information people tend to look for. Figure 1 presents the percent of respondents that said they look for each type of news.
Figure 1. News Topics of Interest to Respondents
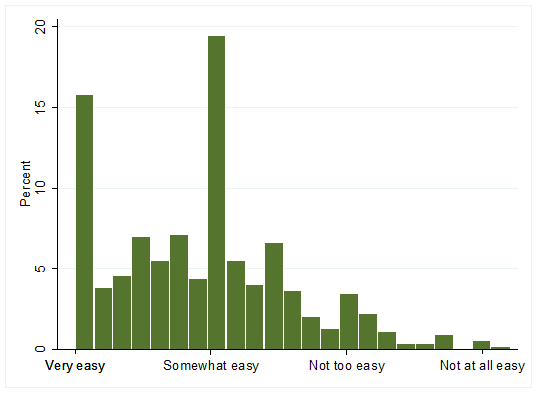
 For each selection the respondent made, we then asked how easy it was for them to find the information they wanted. Figure 2 presents how easily respondents said it was to find this information. Here we present the percent of respondents who said “very easy”, “somewhat easy” and a total for both “very” and “somewhat.”[1]
Weather is by far the most popular and easiest to find: 63% of respondents said they were interested in local weather (the highest of all topics), and of those, 76% (again the highest of all topics) said local weather was “very easy” to find. The other topics that received the highest marks for ease of access to the information were local breaking news (55% saying very easy), local sports (46%), and local traffic and transportation (43%). The topics of Local taxes and tax issues (22%), Community or neighborhood events (26%), State government activity, such as council meetings, hearings, or local trials (27%), Local arts and cultural events, such as concerts, plays, and museum exhibits (28%), Local government activity such as council meetings, hearings, or local trials (29%), Local zoning, building, and development (29%), and Local health and health care issues (29%) were the least likely to be rated as “very easy” to find. When combining “very easy” and “somewhat easy,” the rankings are nearly unchanged, and Local zoning, building, and development (71% very or somewhat easy), State government activity, such as council meetings, hearings, or local trials (75%), and local taxes and tax issues (79%) were the considered the hardest to find.
Figure 2. Ease of Finding Information by Type of News
![]()
Figure 3 presents an average for each person on how easy they said it was to find the information they tend to look for. The data for this makes clear that when respondents think specifically regarding the types of information they tend to look for, that information tends to be less easy to find than when they rate the news as a whole.
Figure 3. Average Ease of Finding Information Across Topic Areas
Rhode Islanders express concern that state and local media do not represent people like them but have some trust in the media
Overall, Rhode Islanders have mixed feelings about how well the media are doing at representing people like themselves: 40% of those surveyed felt that the interests, ideas, and opinions of people like them were underrepresented in the state and local news media. Interestingly, it was respondents with a family income over $100k (50% of respondents in this group) that feel the most underrepresented. However, urban and non-White respondents were also slightly more likely than their counterparts to feel underrepresented.
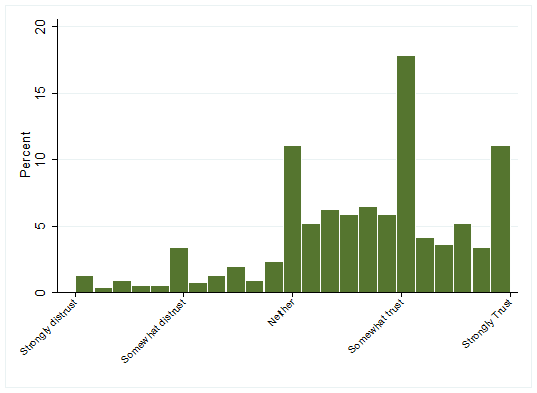
Additionally, Rhode Islanders do not have much trust in the state and local media. Only 24% said they have a lot of trust; 53% said they only somewhat trust the information they get from Rhode Island state and local news organizations. Figure 4 below presents average trust in state and local news for each individual for all the stations they have heard of. This distribution indicates a fairly high degree of trust in the state and local news media. On average, respondents rated the news stations they had heard of at a 3.67 on a scale of 1 to 5—indicating that on average people lean towards feeling at least some trust in their news organizations. This distribution is largely equal across subgroups.
Figure 4. Distribution of Average Trust in Known News Sources
 Rhode Islanders prioritize fairness and accuracy in reporting.
The vast majority of respondents (82%) and a large majority of every subgroup reported their preference for stories that feature a combination of people like themselves and people who are very different from themselves. While this number is likely inflated due to social desirability bias, it still speaks to the fact that Rhode Islanders are not solely interested in learning the views of people who have their same life experiences. That said, very few people prioritized understanding the lives of people from different walks of life as one of their top three priority items for their news media.
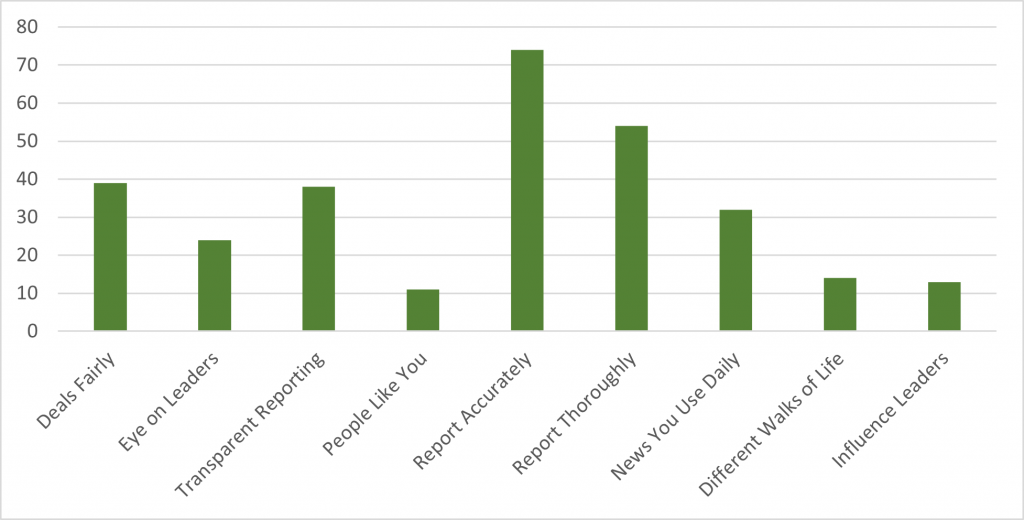
Instead, Rhode Islanders prioritize accuracy in reporting (74% as one of their top 3), covering stories thoroughly (54%), and dealing fairly with all sides (40%). Non-White respondents (18%) and Hispanic respondents (23%) were most likely to prioritize understanding people from different walks of life. Non-White respondents (17%) were also the most likely to say that one of the three most important aspects of news is that it includes information about how the reader can help their community or express their opinion to leaders.
Figure 5. Top Three Priorities for Media Coverage in Rhode Island
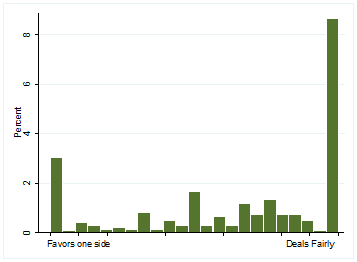
A large percentage of every subgroup felt it was important that news organizations deal fairly with all sides. On this front, the news organizations in Rhode Island are doing fairly well. For each news organization that the respondent indicated they had heard of, we asked whether they felt that news organization “deals fairly” or “tends to favor one side” in presenting the news dealing with political and social issues. Overall, people have a fairly positive view of news organizations. Figure 6 below shows an average score for each individual about how fairly they view the news sources they had heard of.[2]
Figure 6. Average Views of Fairness of Recognized News Organizations
Rhode Islanders prize community connections among journalists.
An overwhelming number of respondents felt that it was important that journalists understand the history of the community (93%) and be personally engaged in the local community (89%). In almost every group, a majority of respondents said that understanding the history of their community was “very important.” However, respondents felt it was far less important that journalists be engaged in social media; only 23% of respondents said social media activity was “very important,” Hispanic (30%), Non-White (28%), and young respondents (27%) were the most likely to feel social media use was “very important.”
Journalists should be watchdogs over state and local officials, but many are concerned that the news media are not doing enough in this role.
Rhode Islanders also felt that it was very important for state and local journalists to serve as watchdogs over Rhode Island’s elected officials. Overall, 57% said it was “very important.” Young respondents were the least likely to feel this role was important (34%).
While serving as a watchdog is overwhelmingly important to Rhode Islanders, many feel that the state and local media are not doing enough to watch over elected officials. While a plurality (48%) said that the media were “getting it about right,” 40% said the state and local media were “not going far enough.” Interestingly, when we look at those who report following state and local news closely “most of the time, whether or not something important is happening,” we find that more (51%) feel that the news is “getting it about right.”
The role of the media in providing analysis and perspective about events and public officials was also prioritized by a majority of respondents. Overall 57% of respondents said they think news organizations should present analysis in addition to just reporting events. This strong majority was found across subgroups.
In Rhode Island, use of social media is high but trust in social media is low.
Not surprisingly, many people report using social media in Rhode Island; however, 40% of respondents reported using none of the social media platforms that were included in the survey in the past week. As expected, those over 60 (54%) were much more likely to report using no social media platforms in the past week than those under 30 (29%). Hispanic and non-White respondents were more likely to use some form of social media.
However, while many people are using social media, trust in social media platforms is fairly low. When asked about their trust in social media sites as sources of state and local news overall, 21% said they had no trust at all in social media sites and 40% said they had “not too much;” only 4% said they had a lot of trust in social media. This was also true across social network platforms; for example, only 5% of respondents who had heard of Facebook said they strongly trust Facebook as a source for state and local news, and 23% strongly distrust the platform. Similarly, 20% of respondents who have heard of Twitter said they strongly distrust it, and only 4% said they strongly trust it for state and local news.
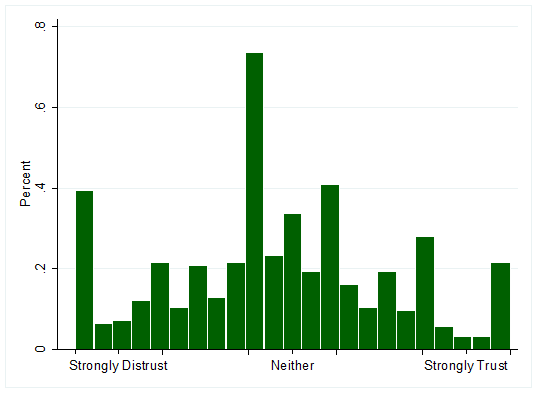
Looking across platforms, these numbers are fairly consistent. On average, people are more distrusting than trusting of social media platforms for state and local news. Figure 7 shows the average trust rating for respondents when we average their trust responses across all platforms.
Figure 7. Average Trust in Recognized Social Media Platforms
While respondents overall were distrusting of social media as a source of information, a majority of respondents report feeling either somewhat (55%) or very (23%) confident in their ability to recognize news that is made up. While a majority in every subgroup said they were either very or somewhat confident, Hispanic (68% either somewhat or very confident compared with 80% for non-Hispanic) and Non-White (69% either somewhat or very confident compared with 80% for White) respondents were the least confident in their ability to recognize made-up news. Education for the public regarding how to spot made up news and how to evaluate news for reliability could be useful.
Rhode Islanders have little understanding of news finances, and only a minority would be willing to pay for their state and local news.
Even in the face of high-profile local and state news media layoffs and shutdowns, most Rhode Islanders are unwilling to pay for state and local news. Part of this is because people do not believe it will make a large difference in their lives. Only 19% of respondents said they have, over the last year, paid or given money to any local news sources by subscribing, donating, or becoming a member. Those most likely to have paid for content were respondents over 60 and high-income respondents. For those who said they had not given money or paid for news, 50% said that the reason they had not is because they can find “plenty of free local news.” Importantly, only 15% said they had not paid because the product was not of good enough quality to pay for. Interestingly, quality issues were most commonly cited among middle-income respondents and non-White respondents. This same phenomenon was underscored by the fact that a majority of respondents felt they would be either unaffected or only slightly affected if the news source they currently use was no longer available. When asked, “If your local newspaper no longer existed, what impact would that have on your ability to keep up with information and news about your local community?”, 42% of respondents said it would have “a small impact” and 40% said “no impact at all.” This sentiment was fairly similar across subgroups.
Some of this unwillingness to pay also may be attributed to a lack of information regarding the finances of state and local news organizations. A large majority of respondents thought that local media organizations were doing either somewhat well financially (50%) or very well (14%). Young people and those whose family incomes were under $50k were the most likely to think the news media’s finances were doing at least somewhat well, whereas high-income respondents were the least likely to say news media finances were doing either somewhat (40%) or very well (12%)
We also asked respondents, “If the only way to get full access to [choice from above] was to pay a $5/10/15 (randomly assigned) monthly fee, would you pay it or not?” for the media organizations that people said they used.
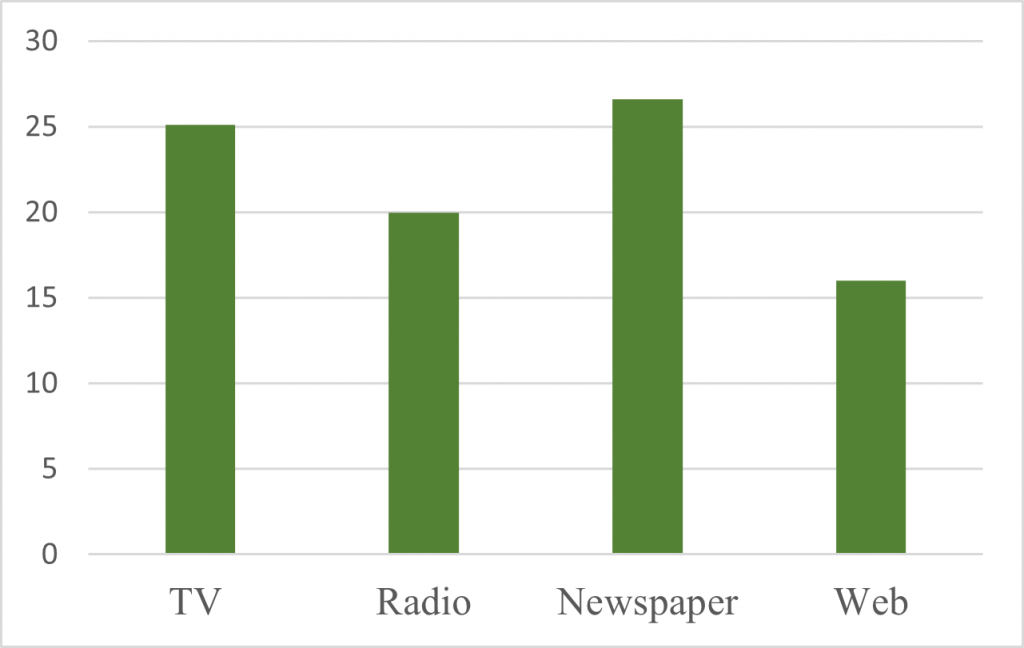
The vast majority (79%) of respondents were unwilling to pay any fee for the news media they use. Even for a small fee ($5), only NPR (59%), which had enough participants to be representative, had a majority of users willing to pay it. The total participants that were willing to pay dropped as the price increased in nearly every case. However, willingness to pay was very low even at the lowest price. A few aberrant cases like that of Telemundo had very few participants and cannot be considered representative. The type of media seemed to matter as well. While most news organizations now have multiple platforms to reach audiences, there is most commonly a main platform such as TV, radio, newspaper, or website that is their area of focus. Participants in general were most willing to pay for access to newspapers (~ 27%) and least likely to be willing to pay for Radio (~20%) and Websites (16%). This is perhaps because most radio stations and websites traditionally have been free to access, and alternatives are easily available.
Figure 8. Willingness to Pay by Platform Type
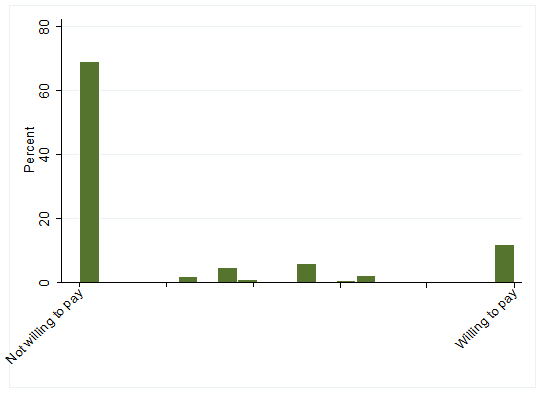
Looking across news organizations, it is clear that while a few people are willing to pay for a one or more of the organizations they use, the vast majority (69%) are not (11% were willing to pay for all the news organizations they use, and ~20% were willing to pay for one or more, but not all). Here a score of 1 would indicate the person is willing to pay for all the news outlets for which they responded and a score of 0 indicates they are willing to pay for none of the outlets. Scores in-between indicate they were willing to pay for some but not all outlets.
Figure 9. Willingness to Pay for News for All News Organizations Rated by Each Individual
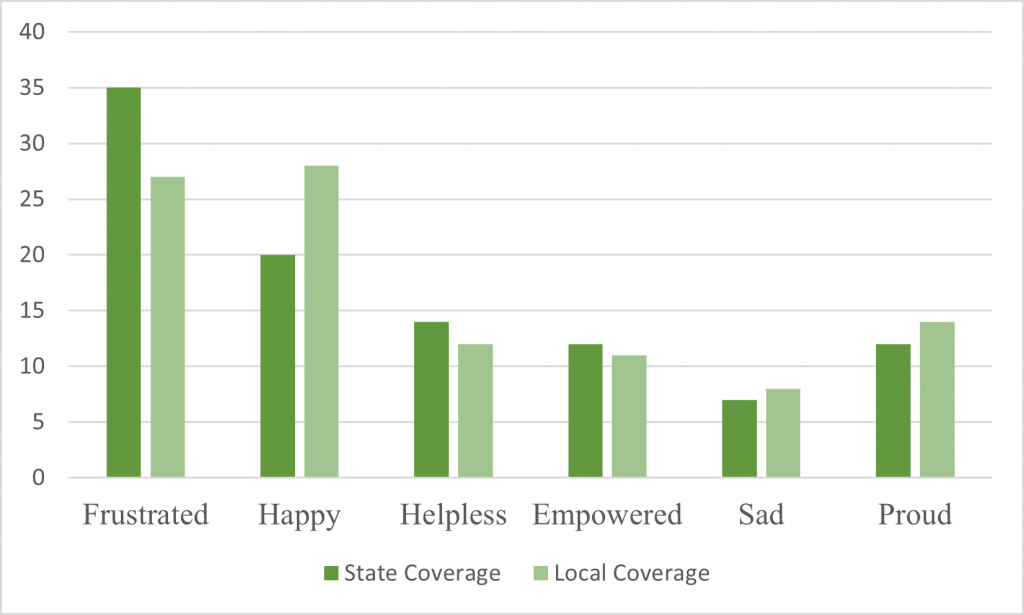
News coverage about the state and its local communities leaves Rhode Islanders feeling frustrated and sad. Local news leaves people feeling more positive than news about the state.
Overall, a majority (58%) of respondents said that reading news about the state leaves them with a negative feeling. A plurality (35%) of respondents said that when they read news about the state, they feel “frustrated.” Urban residents (61%) were more likely to be left with a negative feeling, particularly frustration (40% of urban respondents, compared with only 30% of non-urban respondents). Interestingly, the group most likely to feel proud were those over the age of 60—they were more than twice as likely as middle age and almost twice as likely as young respondents to feel proud after reading about Rhode Island news.
A smaller percentage of respondents (53%) said the news about their local community left them feeling negative. However, a plurality of respondents (28%) report feeling happy when they read about their community, just slightly larger than the percentage of respondents who report feeling frustrated (27%) after reading news about their community. Again, those over 60 were the most likely to feel proud after reading about their community (23%). Also, a higher percentage of urban residents reported feeling proud (18%).
Figure 10. Emotional Responses to State and Local News
Other Findings of Note:
- Older respondents were much more likely to say they seek information from the news about other businesses (not bars and restaurants), community events, and local taxes and tax issues than younger respondents.
- Wealthier respondents were much more likely to say they seek information about State government activity (53% of respondents) and state political campaigns and elections (71% of respondents) than those whose family incomes were under $100k.
- There were significant differences in the types of information sought by racial and ethnic minorities and White respondents. Information about crime was cited more among urban residents (57%) than non-urban (46%) but also much more likely among White respondents (54%) than non-White (41%). Hispanic respondents were the least likely to say they sought information about crime (29% vs. 55% for non-Hispanic). Non-White and non-Hispanic respondents were also far less interested in information about restaurants and bars and several other topics. Information about Local social services that assist with things like housing, food, health care, and childcare was also far more popular among non-White and Hispanic respondents.
- Urban residents also were distinctive. Particularly noteworthy was their interest in local schools (48%), compared with their non-urban counterparts (34%).
- Information about the weather was a popular need across all subgroups, but arts and culture were far more important to wealthier and older respondents.
- Poorer and younger respondents find it harder to find local arts and cultural events. Seventeen percent of those whose family income is under 50k but only 2% of those with incomes over 100k found it “Not too easy” to find and 25% (under 30) vs. 5% (over 60) found it “Not too easy” to find them.
- Hispanic respondents (2%) found it marginally more difficult to find information on “other businesses” compared with their non-Hispanic counterparts, 32% of whom found it very easy to find this information.
- Older residents are more likely than younger residents to get state and local information from radio broadcasts (21% of 60+ respondents reported “very frequently,” compared with just 14% for 30-59-year-olds as well as for those under 30). However, while they listen to station broadcasts more, they are less likely than younger residents (under 30 through 59) to visit those same stations’ websites for state and local information.
- There was a large gap between Hispanic and Non-Hispanic respondents in the use of online blogs and listservs for getting state and local information. “Very frequent” use of these platforms was much more popular with Hispanic users (19% vs. 4%).
- Although getting information from print news was much more popular among age 60+ respondents (26% “very frequent, compared with 9% for both under 30 as well as 30-59), local community newsletters trended higher with respondents under 30 than with those older than 30 (9% “very frequent,” compared with 4% for 30-59-year-olds and 6% for those over 60). Similarly, frequent use of local community newsletters was more popular with non-urban residents than urban residents (7% to 4%), as well as with non-White respondents compared with White respondents (10% to 5%).
- Going directly to the source by visiting government websites for local information was more popular among Hispanics (64% said very or somewhat frequently) than non-Hispanic respondents (40%). It also was less popular among those over 60 (34% vs. 42% for respondents under 30 and 51% for middle-aged respondents).
- Throughout the survey, there was a general trend for respondents under 30 to more frequently use hyper-local, less regulated, more user-driven sources compared with older audiences. With local community newsletters, local information from social media, and local information from word of mouth, respondents under 30 dominated in “very frequent” use compared with those who were older. With larger-scale and more systematically-regulated sources (sources that do not primarily consist of user-driven content) such as state and government websites, local newspapers, local radio broadcasts, and local TV news, respondents under 30 were consistently outnumbered by older respondents in “very frequent” use.
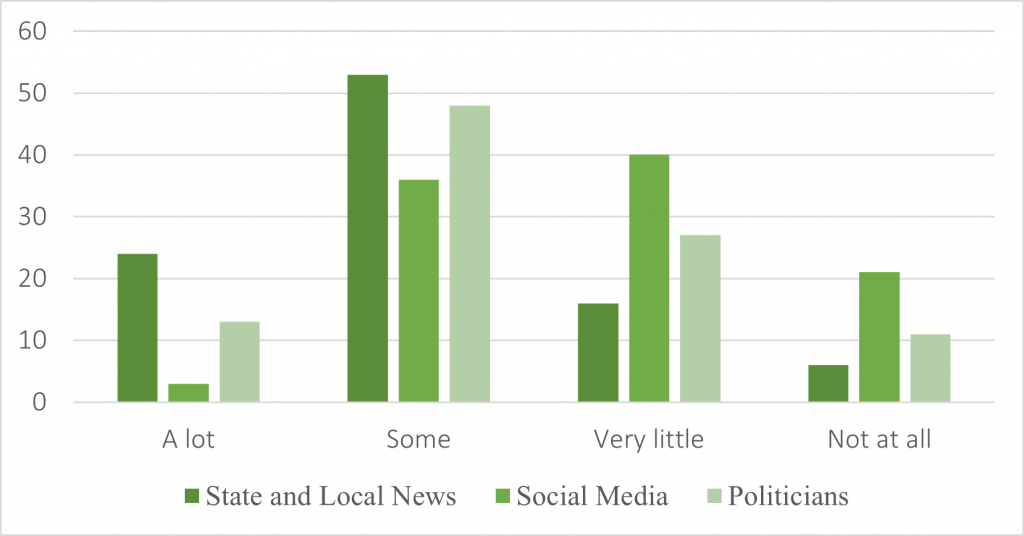
- Trust in information received from political leaders and public officials in Rhode Island is lower than trust in local news but higher than trust in social media. Trust in state officials was much higher among non-White respondents (72% said they trust state officials a lot (24%) or some (48%)) and Hispanic respondents (61% said they trust state officials either a lot (21%) or some (44%)). Overall, only 13% of respondents say they trust state leaders “a lot,” and 48% said they have “some” trust in state officials. (See Figure 11)
Figure 11. Trust in State and Local Media, Social Media, and State and Local Politicians
[1] How easy it is to find this information was only asked of respondents who said they were interested in news of this type.
[2] People who responded “unsure” are excluded from the data. The figure only presents data for those who had an opinion.