Where Blocks Meet Data: How Fast Can You Build?
One of the most fundamental concepts in education is also one of the easiest to see for yourself: the more you practice a task, the faster and more reliably you do it. That pattern has a name—the learning curve—and understanding it only requires a few building blocks.
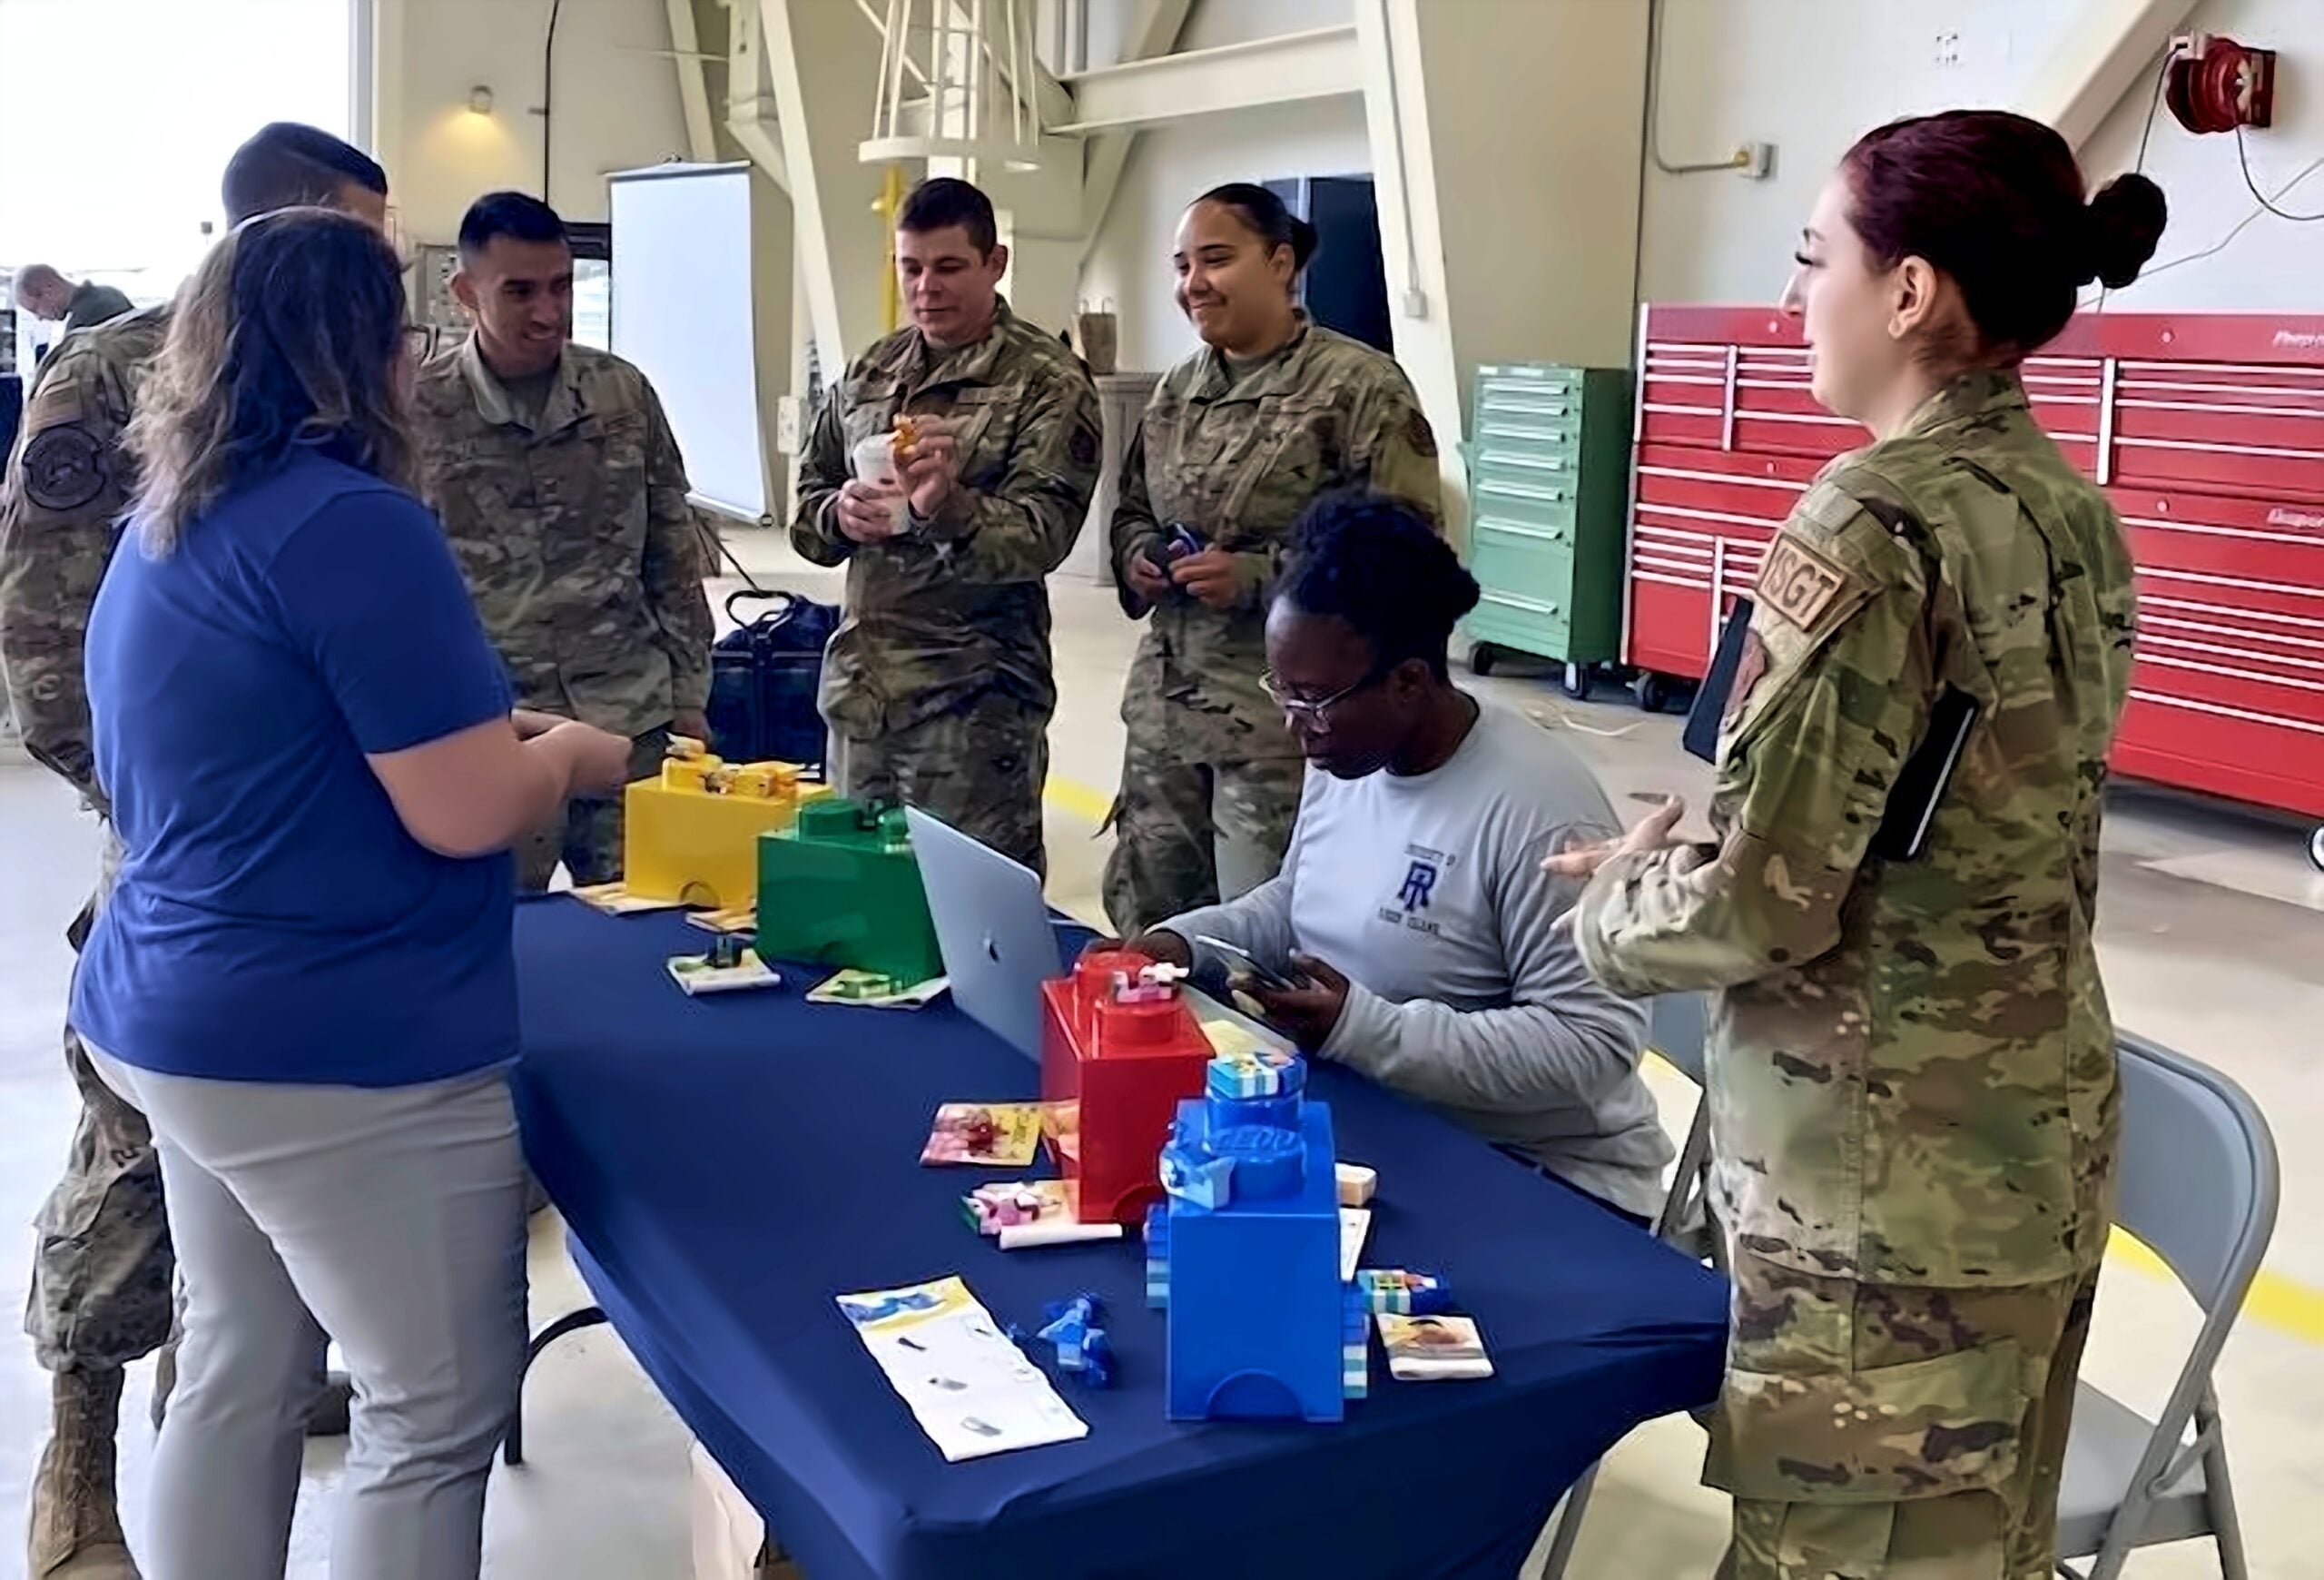
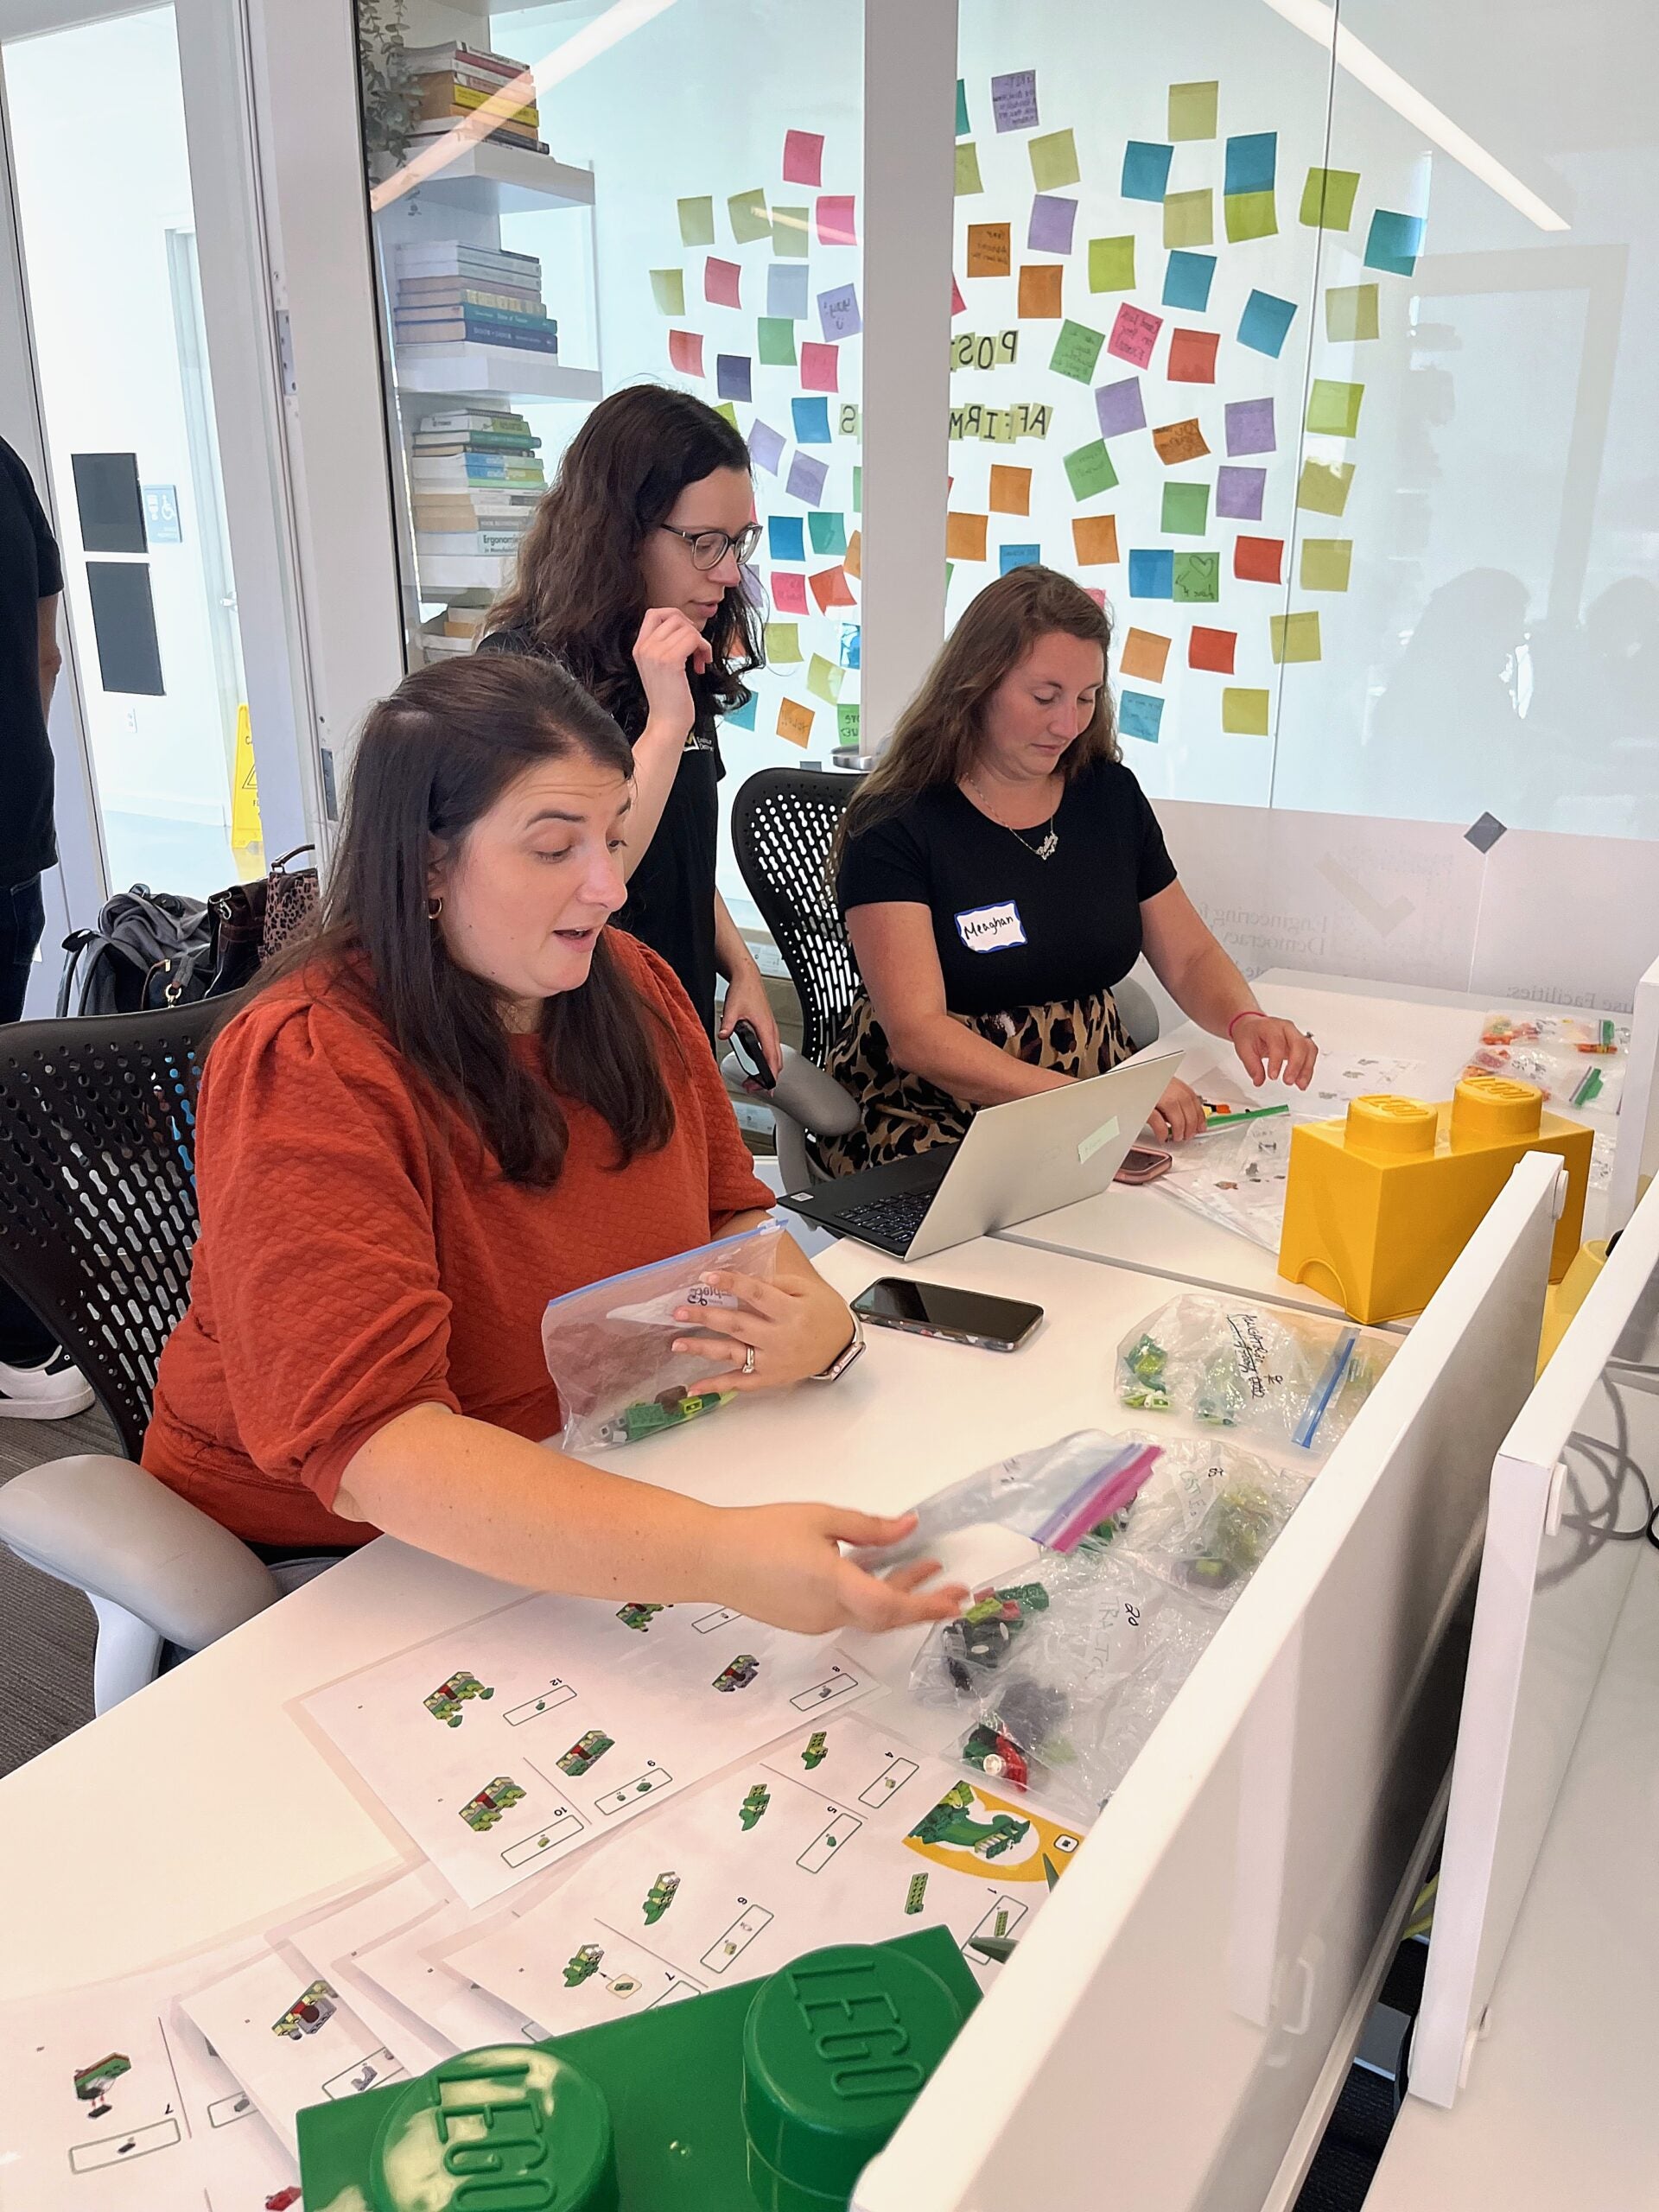
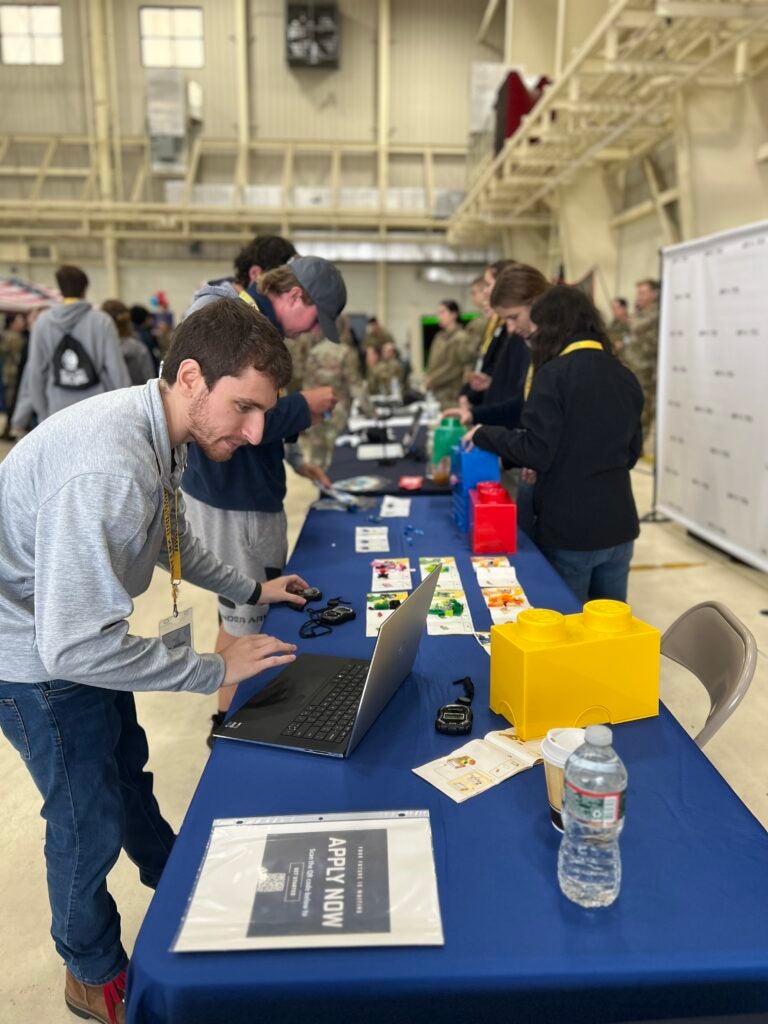
Much of election work is manual, and every poll worker improves at their own pace, whether checking in voters or setting up equipment. Recognizing how people learn and where they plateau helps election officials plan staffing and training. In this activity, you repeatedly build the same brick set, timing each attempt. Using our app, you can chart these times on a personalized learning curve, visually tracking your improvement over time and observing how your speed increases and where progress slows. Since individuals learn at different paces, each curve is unique, offering a personal way to analyze and compare.
Make Your Own Curves
ACCESS THE APP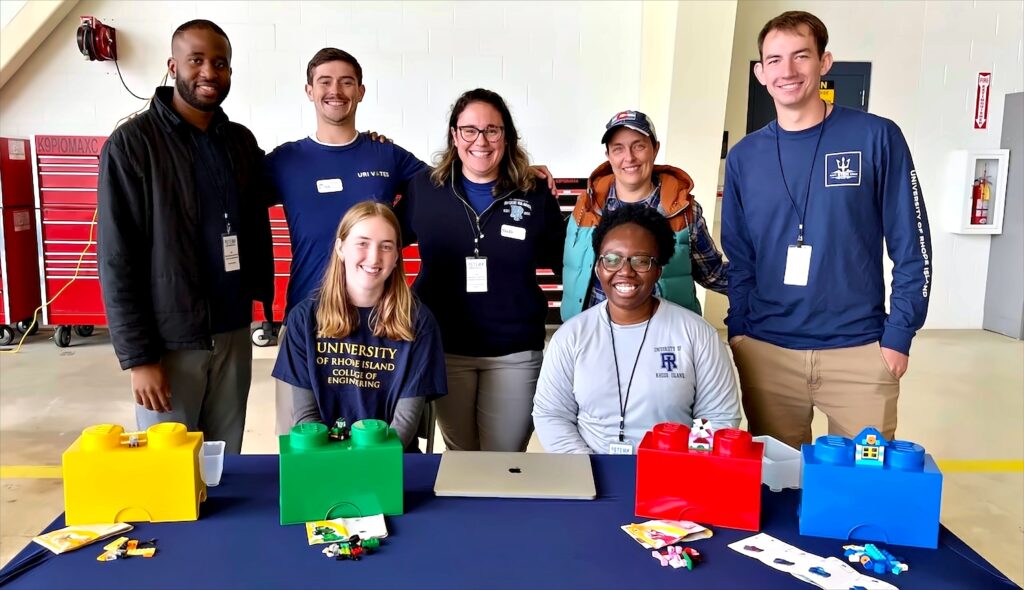
The activity builds on our published research, “Learning’ Learning Curves’ with R Shiny,” bringing a real engineering approach into the classroom that anyone can learn and experiment with.