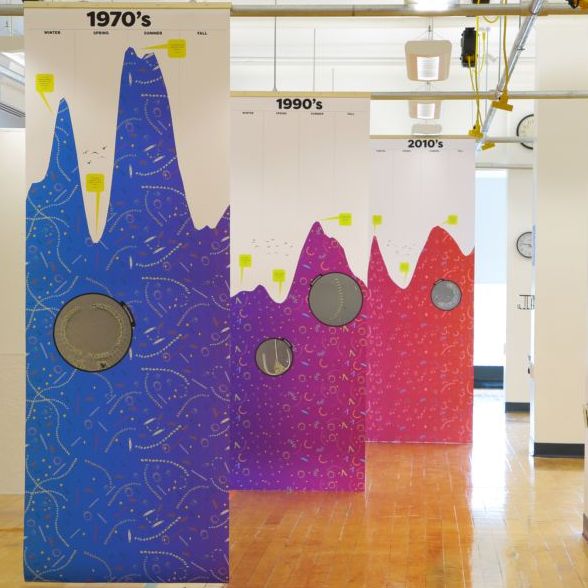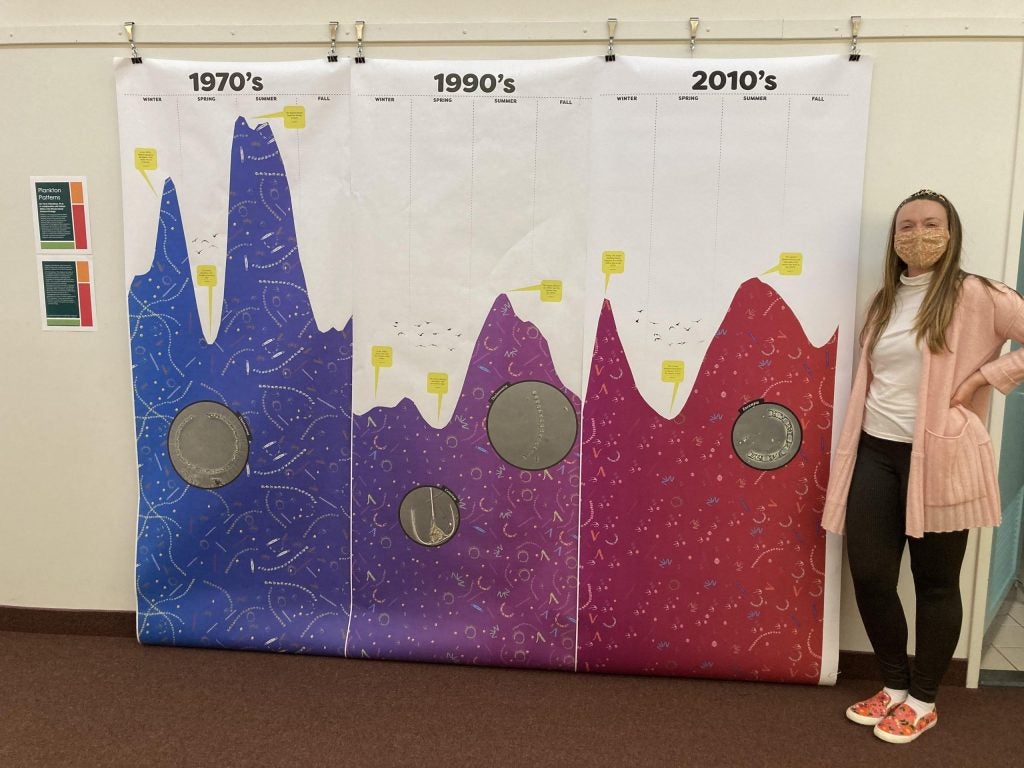
Rynearson Lab Postdoc, Tricia Thibodeau, wanted to visualize the decrease of phytoplankton abundance due to long-term seawater warming and nutrient shifts in the Bay. Since the 1950’s, the Narragansett Bay Long-Term Plankton Time Series (https://bit.ly/32nHnNX) has monitored the abundance and types of plankton inhabiting Rhode Island’s most well-known body of water. Thanks to this wealth of data, Thibodeau was able to average the seasonal phytoplankton abundance across three different decades: the 70’s, 90’s, and 2010’s. Inspired by intricate wallpaper patterns, she created three 8’x 3’ hanging banners. From a distance, each banner looks like a cross section of a colorful ocean. The ocean surface is actually the plotted graph curves of phytoplankton abundance. On closer inspection, there are yellow text bubbles highlighting important data as well as large photographs of actual phytoplankton taken with a microscope. The repeating phytoplankton patterns are digital drawings based on microscopic images and were created using Adobe Illustrator. The placement of the phytoplankton across the banner corresponds to the abundance of each species from season to season.
This project was developed during the Vis-a-thon workshop. In collaboration with the Edna Lawrence Nature Lab at the Rhode Island School of Design, Vis-a-thon aimed to promote visualization as an integral facet of research methodology and provide opportunities for participants to experiment with innovative ways to create and effectively utilize visual imagery and language. This project was funded by RI C-AIM.
Thibodeau also displayed her project publicly at the North Kingstown Free Library with a virtual presentation to the public in April 2021.

