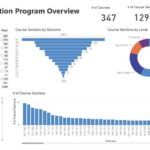
The General Education Program dashboards give an overview of the Learning Outcomes and Grand Challenge Overlay within the General Education Program at the University of Rhode Island. The dashboards were created using Power BI, a data visualization tool from Microsoft. Enrollment data was obtained from Enrollment Services for the spring 2023 semester. The dashboard provides insight to the number of courses and course sections, distribution of courses among course levels, and courses offering the most sections within each learning outcome. The dashboards can be used for obtaining a broad overview of the distribution of General Education courses.
 General Education Overview - The General Education Program at the University of Rhode Island is comprised of a wide breadth of interdisciplinary courses that satisfy one or more the 12 Student Learning Outcomes and the Grand Challenge Overlay.
 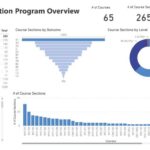 A1 – STEM - Science, technology, engineering, and mathematics disciplines develop critical thinkers and innovators that can address and solved problems facing and ever-changing and growing world.
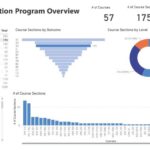 A2 – Social and Behavior Sciences - The Social and Behavioral Sciences Learning Outcome (A2) focuses on our understanding of people’s behavior individually and collectively.
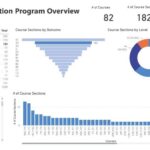 A3 – Humanities - Most represented in the General Education Program, the Humanities Student Learning Outcome (A3) provides students with the opportunity to engage with varied forms of human expressions and its influence on humankind’s understanding of itself and its place in the universe.
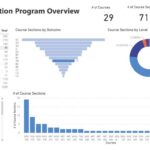 A4 – Arts and Design - The Arts and Design Learning Outcome (A4) focuses on fostering an appreciation for the arts and design.
 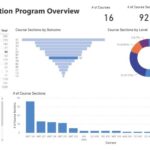 B1 – Write Effectively - Courses satisfying the Write Effectively Learning Outcome (B1) give students the opportunity to develop the skills to write effectively in both an academic and professional setting.
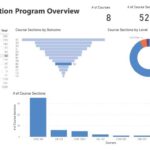 B2 – Communicate Effectively - Courses that satisfy the Communicate Effectively Learning Outcome (B2) engage students in communicating ideas and information through varying avenues and diverse audiences.
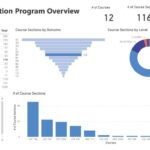 B3 – Mathematical, Statistical, or Computational - The Mathematical, Statistical, or Computational Learning Outcome (B3) facilitates student’s ability to create arguments supported by quantitative evidence presented in a variety of formats including words, graphs, charts, and tables.
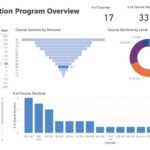 B4 – Information Literacy - The Information Literacy Learning Outcome (B4) encourages students to critically analyze and use information from multiple sources in an ethical manner.
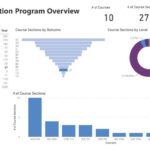 C1 – Civic Knowledge and Responsibilities - The Civic Knowledge and Responsibilities Learning Outcome (C1) encourages students to participate in civic discourse and activities of personal and public concern that benefit both individuals and the community.
 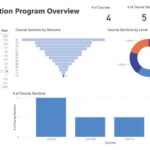 C2 – Global Responsibilities - The Global Responsibilities Learning Outcome (C2) focuses students on identifying and analyzing responsible actions for complex global issues.
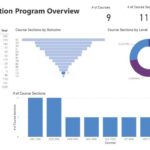 C3 – Diversity and Inclusion - The Diversity and Inclusion Learning Outcome (C3) exposes students to different cultural perspectives in the United States and broader community.
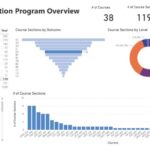 D1 – Integrate and Apply - The Integrate and Apply Learning Outcome (D1) encourages students to recognize the interrelatedness and connectedness of knowledge and ideas that can apply to new and complex situations.
 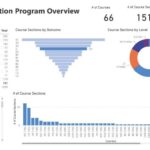 Grand Challenge Overlay - The center piece of the General Education at the University of Rhode Island, the Grand Challenge Overlay (G), is the culminating experience for undergraduate students.