
New website developed by URI researchers illustrates impact of nor’easters and hurricanes over decades
September 23, 2026
The University of Rhode Island has made one of the world’s oldest and continuous beach survey efforts available online via Rhode Island Beach Dynamics Over Decades, a new public website.
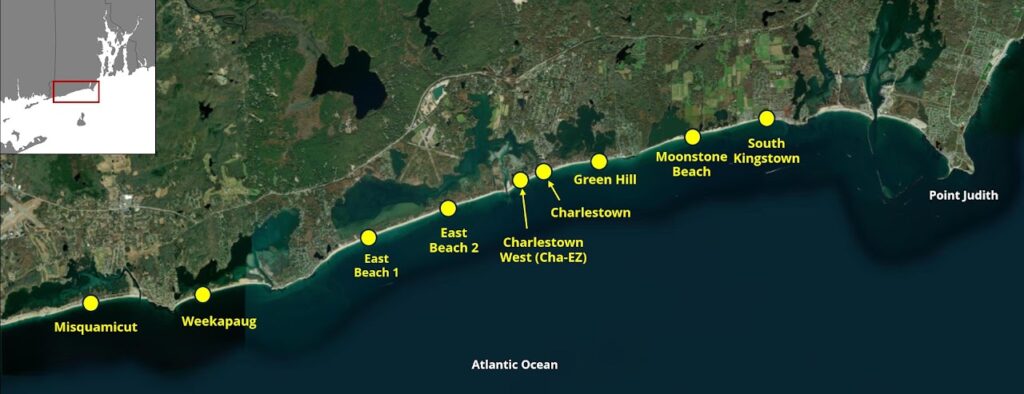
Since 1962, about four dozen students and several scientists from the URI Graduate School of Oceanography (GSO), the URI Environmental Data Center, the URI Department of Geosciences, and Eastern Connecticut State University have monitored the shorelines of eight Rhode Island beaches, collecting measurements and images that reveal short- and long-term changes and the impact of severe storms.
This website took a year and a half to develop. The project was funded through a grant from the Rhode Island Executive Climate Change Coordinating Council (EC4).
“I’m thrilled to have this website published, not only because we put in a lot of hard work to make it—but also because students and staff have been braving the elements and other challenges for decades,” said J.P. Walsh, URI professor of oceanography, marine geology, and geophysics. “It’s great to have this information compiled for all to see and use.”
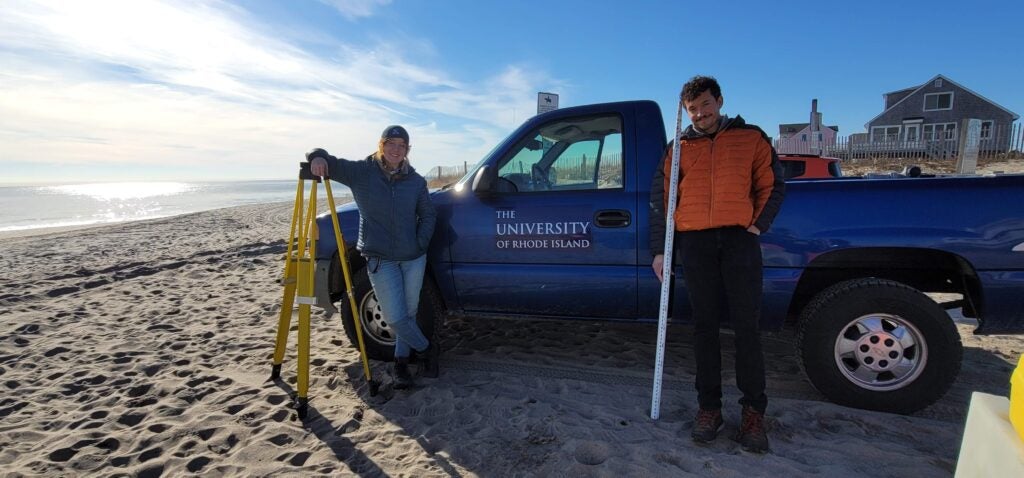
Walsh spearheaded the website with Mary Klimasewiski, a marine research associate in GSO.
“We’re excited to bring decades of beach survey data together in a publicly accessible resource, making it easier for managers, researchers, and the public to visualize and understand how our coastline is changing over time,” said Klimasewiski.
Klimasewiski earned a master’s degree in data science from URI in 2025. She applied that knowledge when handling decades of information for the website.
“My data science studies shaped how I approached this project, from organizing and integrating a large, complex dataset to developing clear visualizations that make the data easier to explore, understand, and use,” said Klimasewiski.
As the supervisor of the GSO beach survey since 2020, Walsh is proud that more than 60 years of scientific data has been preserved and is now available to the public.
“It’s awesome to be a part of something so lasting and impactful,” said Walsh. “Many students talk about their memories of measuring beaches. The results they have generated can serve as a permanent record of the dynamism and disappearance of the Ocean State coastline.”
What is a beach profile?
A beach profile is created when a scientist measures a series of elevation points across a beach, from the waterline to the landward vegetation. These surveyed points are plotted on a graph to show the shape of a beach at a specific point in time. By repeating these measurements over time, changes can be seen and calculated. Also, the beach volume may be determined by quantifying beach cross-shore area for and alongshore distance.
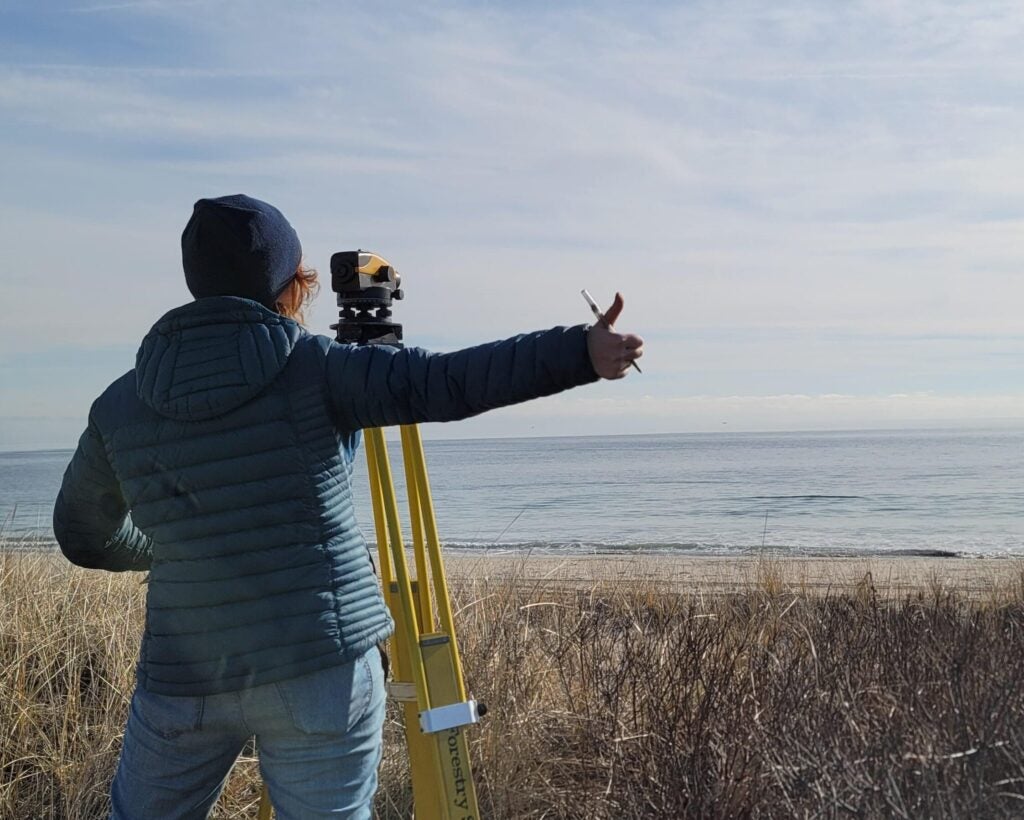
Historically, beaches were surveyed using a tripod-mounted survey level and stadia rod. One person would look through the survey level at the person holding the stadia rod to determine the height above the ground and the distance to the rod. This technique was time-consuming and required careful coordination.
Around 2023, a real-time kinematic global positioning system replaced the tripod-mounted survey level and stadia rod as the standard practice for beach surveying. The faster, easier system links to a network of base stations to capture accurate location and elevation measurements at a survey point. An antenna collects time signals from a constellation of satellites, while the controller connects in real-time to an online network for corrections.
What beachgoers don’t see
On beautiful summer days, Rhode Island’s beaches can be packed with locals and tourists, but most visitors don’t think about how the shoreline evolves over time. Fortunately, URI researchers work year-round to chronicle these changes.
“Everyone likes to go to the beach on a nice summer day, but people rarely visit during storms and other seasons,” said Walsh. “The profiles demonstrate how the beach is alive… growing, shrinking, and changing as seawater and sedimentation reshape it. Like snowflakes, beaches never look the same again, and it’s important for communities to appreciate and plan for these transformations.”
A page of the new website is devoted to the impact of storms, which includes hurricanes and winter storms. Using photos and graphics, the website explains how high-water levels can erode dunes and cause flooding.
One example used to illustrate this is Hurricane Sandy in 2012. Though Sandy was not a direct hit on Rhode Island, it caused high water levels and large waves that induced significant beach and dune changes. The site allows visitors to view how the hurricane impacted each of the eight beaches surveyed.
It takes a team
Several people helped Walsh and Klimasewiski build and launch the new website, including Mike Bradley, Chuck Labash, and Chris Daman from the URI Environmental Data Center; Nate Vinhateiro of the URI Coastal Institute; Bryan Oakley from Eastern Connecticut State University, and Emily Hall from the Coastal Resources Management Council. Beach survey students Zachary Levitan and Kathryn Staebler assisted with data organization, field photographs, and draft text.