All DSDP/ODP Sites
This map shows the locations of all DSDP/ODP sites available in the database. This includes Legs 1 through 185 for now, but we are in the process of updating the database through Leg 191.
Sulfate Data
This map shows the depth of the deepest sulfate (SO4-2) measurement made at each DSDP/ODP site. If a site is not plotted, there are no sulfate measurements in the database for that site. The map does not contain any information regarding the number or density of measurements, or the data quality.
Meters below sea floor (mbsf) to which SO4-2 concentration data extend at each site.
Manganese Data
This map shows the depth of the deepest dissolved manganese (Mn+2) measurement made at each DSDP/ODP site. If a site is not plotted, there are no measurements in the database for that site. The map does not contain any information regarding the number or density of measurements, or the data quality.
Meters below sea floor (mbsf) to which Mn+2 concentration data extend at each site.
Iron Data
This map shows the depth of the deepest dissolved iron (Fe+2) measurement made at each DSDP/ODP site. If a site is not plotted, there are no measurements in the database for that site. The map does not contain any information regarding the number or density of measurements, or the data quality.
Meters below sea floor (mbsf) to which Fe+2 concentration data extend at each site.
Nitrate Data
This map shows the depth of the deepest dissolved nitrate (NO3-) measurement made at each DSDP/ODP Site. If a site is not plotted, there are no NO3- measurements in the database. The map does not contain any information regarding the number or density of measurements, or the data quality.
Meters below sea floor (mbsf) to which NO3- concentration data extend at each site.
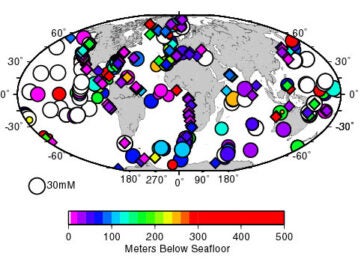
Sulfate Profile Map
Sulfate is the most abundant terminal electron acceptor in sediments deep beneath the seafloor. Our global SO4-2 map displays the subsurface depths and SO4 -2 concentrations at which downward-diffusing SO 4 -2 stabilizes (circles) or disappears (diamonds) at ODP sites throughout the world ocean (D’Hondt et al., 2002 ). White circles indicate that the SO4-2 stabilizes above five meters below the seafloor. Please check the details of the data and methods that went into making this map.
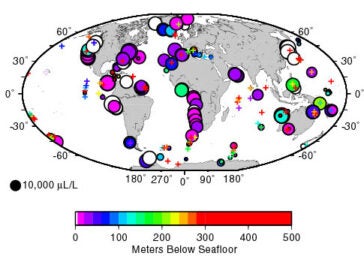
Methane Profile Map
This map shows the downhole depths at which relative methane concentrations in ODP samples first rise above the laboratory background value (about 4 µL/L). It also displays the peak methane concentration measured at each site. The size of the circle indicates the maximum methane concentration and the color indicates the depth at which methane first appears going down-hole. White circles indicate that methane reaches within five meters of the sea floor. Crosses indicate sites where methane does not occur above laboratory background concentrations. The color of the cross indicates the maximum sample depth.