 Home
Home Browse
 Close
Close Events
 Maps
Maps Email
Email Brightspace
 eCampus


Cellulose Synthase Genes: Where do we start?
All branches on the tree of life share common roots. One way to study those roots is to look to DNA sequences. So, when the Roberts lab began studying the evolution of cellulose synthesis, one place they looked was at the available DNA sequence information. Even now, as they expand their studies to include additional species of plants and algae, this is where they start.
Cellulose is an important part of the cell walls of plants, most algae, and even some prokaryotes. The genes that code for the proteins that make cellulose are called CesA genes, and they were first identified from a bacterium that makes cellulose, Acetobacter xylinus (Saxena, Lin, and Brown, 1990). The genes in all cellulose producing plants studied so far have some things in common. They all have DNA sequences with “conserved regions”, meaning that the code produces proteins that have sections where the amino acid sequences are identical. For example, all the CesA genes have a region that codes for the following sequence of amino acids (each letter represents a certain amino acid sequence): DDG. Use the chart in Figure 1 and write the names of the amino acids in the sequence DDG.
Table 1: One of the conserved amino acid sequences coded by all cellulose synthase genes is DDG. Use the information in Figure 1 and write the full name for each of these amino acids.
|
1-letter abbreviation |
D | D | G |
| Amino acid name |
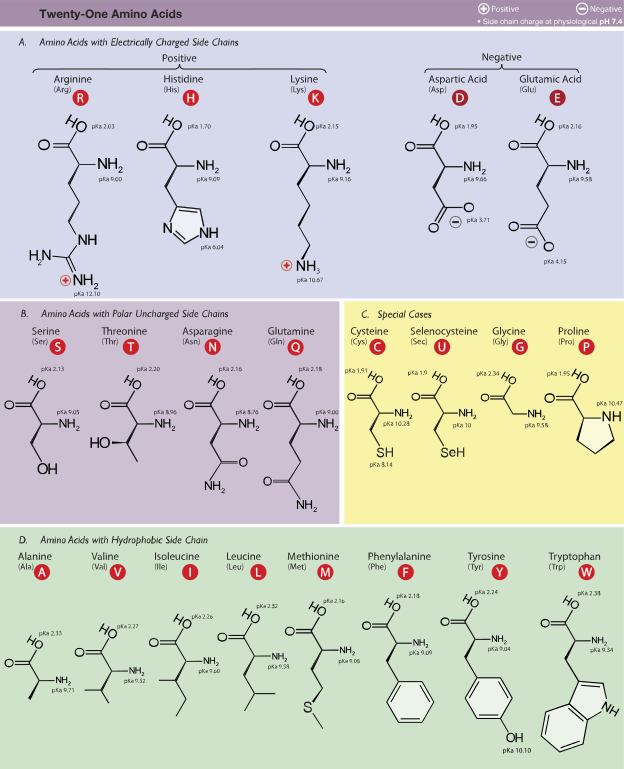
Figure 1: These are the amino acids incorporated into proteins. The full name, three-letter and 1-letter abbreviations are given for each. Notice that the side chain differs on each amino acid. This is what gives each amino acid its distinct properties. (Dancojocari)
Since codons consist of a sequence of three nucleotides and there are four different nucleotides in RNA and DNA, there are 64 different possible codons. Since there are only 20 different types of amino acids that get incorporated into proteins, some amino acids can be coded for by multiple codons. Use the codon chart in Figure 2 to determine all the possible codons that would result in the incorporation of the amino acids indicated previously in Table 1.
Table 2: Possible codons which could product the indicated amino acids.
| Aspartic Acid | Glycine | |
| List all possible codons for these amino acids: |
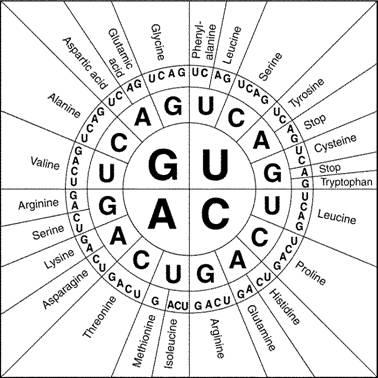
Figure 2: Circular codon chart (https://collegebiology.files.wordpress.com/2014/09/proteincodonwheel.jpg)
Remember, these codons are found on mRNA, and mRNA is created through the process of transcription. Transcription rewrites the information found in the sequence of deoxyribonucleotides into ribonucleotides. Table 3 shows a sequence of amino acids that makes up one of these conserved regions of a CESA protein. It also shows one of the possible RNA sequences that would be translated as that amino acid sequence. Remembering that adenine is complementary to thymine and uracil, and cytosine is complementary to guanine, fill in the sequences of complementary deoxyribonucletides that would have guided the production of this mRNA in the process of transcription.
Table 3: Determining a DNA sequence that is complementary to the given piece of RNA and would code for the production of the DDG portion of a CESA protein.
| Amino acid sequence | Aspartic Acid—Aspartic acid —Glycine |
| One possible RNA sequence | GACGAUGGG |
| Complementary DNA sequence |
What you just did in Table 3 is referred to as “reverse transcription.” This is actually what some RNA viruses do when they infect cells. They reverse-transcribe their RNA and incorporate it into the DNA of the host cell. This process is also used by molecular biologists (biologists whose studies involve DNA, RNA, and proteins) to create something called a cDNA library. We will explore that more in a later module.
As you have probably already realized, because some amino acids can be coded for by multiple codons, there are a number of DNA sequences that could lead to the translation of the amino acid sequence given in Table 3. Writing out all the possibilities certainly wouldn’t be too hard, but it would be time consuming. Then, searching manually for these sequences in the databases would be so time consuming as to make it practically impossible. So, biologists have worked with computer scientists to write algorithms to help make these processes faster. In fact biologists and computer scientists have collaborated so much in the past couple decades that a whole new field has emerged called “bioinformatics.”
The tools created through the many collaborative efforts of biologists and computer scientists allow us to study the evolutionary process in a whole new way. Now we can compare the sequences of DNA from different organisms in order to study their relatedness rather than trying to deduce their relatedness based on physical appearance. Let’s explore some of these tools to get a better understanding of how the researchers in Dr. Roberts’ lab search of CesA genes from other plants and algae. Go to this link:
This link takes you to a page managed by the National Institutes of Health. We will do a BLAST search. BLAST stands for “Basic Local Alignment Search Tool.” We will use it to find other DNA sequences that have been entered into the database that might be part of CesA genes. Before we use this tool however, we should probably try to understand a little more about how it works.
When researchers sequence DNA that they isolated from an organism, it is often in many chunks ranging from 10’s of base pairs (bp) to 1000’s of bp. These are long bits of sequence such as CCGACGAUGGG…. When the researchers submit this sequence data, they don’t know if the sequence is from the sense strand or the antisense strand, and they don’t know where the reading frame is. (A reading frame is a group of three nucleotides that go together to form a codon.) Remember in the process of translation, the antisense strand is used to make the mRNA through complementary base-pairing. So, with the DNA sequence of CCGACGAUGGG, there are 6 possible translations of this, one for each of the three possible reading frame positions if this is the antisense strand, and one for each of the three possible reading frames if this is the sense strand. This can be confusing, so follow the instructions in the caption for Table 4 to do these different translations to get a clearer understanding.
Table 4: For any section of DNA sequence submitted to one of the databases, the position of the proper reading frame is initially unknown. Until the sequence is analyzed, it is also unknown whether the sequence is from the sense or antisense strand of the DNA molecule. You will analyze a small section to determine the proper reading frame and if it is the sense or antisense strand of DNA. Follow the models. Use the codon chart in Figure 2 to determine the amino acids.
| The following is a small sample sequence of nucleotides was submitted to a database:
GGCTGCTACCCT In the spaces below, translate the six possible amino acid sequences for which this might code. Remember, when reading the codon chart, substitute uracil where you see thymine:
|
| Reading frame 1, as if this was the sense strandGGC TGC TAC CCT => glycine – cysteine – tyrosine – proline |
| Reading frame 2, as if this was the sense strandG GCT GCT ACC CT => |
| Reading frame 3, as if this was the sense strandGG CTG CTA CCC T => |
| The complement of the submitted sequence, Reading frame 1, as if this was the sense strandCCG ACG ATG GGA => |
| The complement of the submitted sequence, Reading frame 2, as if this was the sense strandC CGA CGA TGG GA => |
| The complement of the submitted sequence, Reading frame 3, as if this was the sense strandCC GAC GAT GGG A => |
| Now, if someone submitted a query for the amino acid sequence DDG, which of these possible translations would be identified? Would you know that this DNA sequence matched the amino acid sequence if you only looked at the first reading frame? |
When someone wants to search the DNA sequence database for genes or parts of genes that might code for particular proteins, first they might start by typing in the amino acid sequence. The BLAST algorithm then searches through all the possible translations for each DNA sequence in the library looking for matches. After it finishes the search (it may take a couple minutes) the program will give a report about matches and near matches along with data about how closely things line up. From the website given previously, scroll down and click on “tblastn”. To see this output, type this amino acid sequence into the query box and click on “BLAST”:
DYPVDKVSCYISDDG
This sequence of amino acids is part of the CesA found in cotton, an angiosperm, and Physcomitrella, a bryophyte. Once you get the results, scroll down the page to see the list of “sequences producing significant alignments.” Answer the questions below.
- Are there any of the results that show 100% identity to the sequence from your query? Why or why not? If so, what species are they from?
- Look at the list and choose one result that does not have 100% identity. Write the species name here:
Look up the common name of this plant. Write it here:
- Click on the name of the plant. This takes you to a screen where we can learn more about the part of the DNA sequence that was found to align with the sequence that we queried. Here there are also links to additional information. Click on “GenBank”. What kind of information is available here?
Why do you think that this information must be submitted whenever a sequence is submitted to the Gene Bank?
Researchers in the Roberts lab and in the labs of their collaborators use the similarities in all CesA genes to find more CesA genes in additional plants, algae, and bacteria as we explored in the activity. Once found, they use additional tools to study their differences to learn more about how these genes evolved.
Works Cited
“Amino Acids” by Dancojocari – Own workPrint It HereThis vector graphics image was created with Adobe Illustrator.iThe source code of this SVG is valid.. Licensed under CC BY-SA 3.0 via Wikimedia Commons – http://commons.wikimedia.org/wiki/File:Amino_Acids.svg#mediaviewer/File:Amino_Acids.svg
Saxena,IM, FC Lin, and RM Brown, Jr, 1990. Clonig and Sequencing of the cellulose synthase catalytic
subunit gene of Acetobacter xylinum. Plant Mol Bio. 15: 673-683.
Searching for Genes, word
Searching for Genes, pdf
Searching for Genes student answer sheet, word
Searching for Genes student answer sheet, pdf
Why do higher plants have so many CesA Genes?
Title: Do some CESA genes protect the moss from salt stress?
Introduction
What happens when cells are placed into a solution that contains more solutes that the inside of the cells? The cells experience osmotic stress. Water moves out of the cells down gradient from the inside where the water potential is higher to the outside where the water potential is lower.
When plants experience drought, high salinity, or extreme temperatures, they are really dealing with osmotic stress. Plants cannot run away to a shady spot or go to the fridge and get a fresh cool drink. Instead, evolution has equipped vascular plants to deal with this sort of stress.
But what about mosses, which lack anatomical features that prevent dehydration such as true leaves with thick cuticles, efficient water transport systems, and extensive root systems? What do delicate mosses do in response to osmotic stress? This is a question that investigators are actively working to answer so we can better understand the biochemistry involved in this sort of stress response. This is related to their studies of the evolution of the genes involved in cellulose synthesis. Understanding plant responses to osmotic stress is especially important now because many of our most productive agricultural soils are becoming saltier because of irrigation practices.
When an agricultural field is watered, that water also contains salts. Much of the water evaporates off the surface of the plants and soil. Much water is also transpired, moving directly from openings in the leaves (stomates) into the atmosphere. In both cases, water is lost, but the salts are left behind. If there is not sufficient rainfall, the salts don’t get washed out of the root zone and accumulate there. This causes significant osmotic stress to plants.
In this module, we will assess the effect of osmotic stress on chlorophyll content of the moss Physcomitrella patens as an indication of overall health to investigate the role of cellulose synthase genes in resiliency in the face of this challenge.
Problem: Do some CESA genes protect the moss from salt stress?
Alt Problem: Do some moss species tolerate salt better than others
Materials and Methods
- Petri dishes containing BCDAT
- Petri dishes containing BCDAT+500uM NaCl
- Eppendorf tubes and plastic pestles
- Forceps (probably don’t need to be sterile)
- Filter paper and small funnels
- Spectrophotometer and cuvettes
- Physcomitrella patens: / Alt moss cultures (see moss culture instructions)
- Use 6 day old moss and spot plate them on 500uM NaCl BCDAT.
- To set up the spot plate, select approximately 5 sections of healthy material from a source plate approximately 0.5 cm2, and transfer them with sterile forceps to a new plate of appropriate culture media.
- Place into incubator set to 25°C with constant illumination at 50–80 mmol/m2/s (alt: place cultures under fluorescent lamps at room temperature)
- After for 5 – 6 days of growth, collect and weigh moss colonies in clean microcentrifuge tubes (find the mass of the empty tube first…)
- Grind up tissue in the microcentrifuge tube using a plastic pestle and add 1 mL 70% Ethanol.
- Incubate for 10 minutes.
- Filter into cuvette.
- Use spectrometer to measure absorbance at 649nm and 664nm.
[ from ref: “Chlorophyll content, fresh weight and dry weight of plants were determined in three independent experiments using 3 plates containing 5 colonies per genotype per treatment and per time point. Dry weight was measured after incubation of individual plant colonies on cellophane discs for 16 h at 80°C. For the determination of chlorophyll content, each plant was ground up in a mortar containing 5 ml of 80% (volume in volume, v/v) acetone and the homogenized plant material was filtered to remove cell debris. Total chlorophyll was calculated as chlorophyll a + chlorophyll b (mg g-1 fresh weight) using the following formula: Chla mg/g = [(12.7 × Abs663) – (2.6 × Abs645)] × ml acetone mg-1 fresh tissue; Chlb mg/g = [(22.9 × Abs645) – (4.68 × Abs663)] × ml acetone mg-1 fresh tissue.]