Field Program
June 2009 – June 2011
Principal Investigators
- Mark Wimbush, University of Rhode Island
- Jae-Hun Park, University of Rhode Island
Japanese Collaborators
- Hirohiko Nakamura, Kagoshima University
- Ayako Nishina, Kagoshima University
Funding for this project was supplied by the Office of Naval Research.
Goal
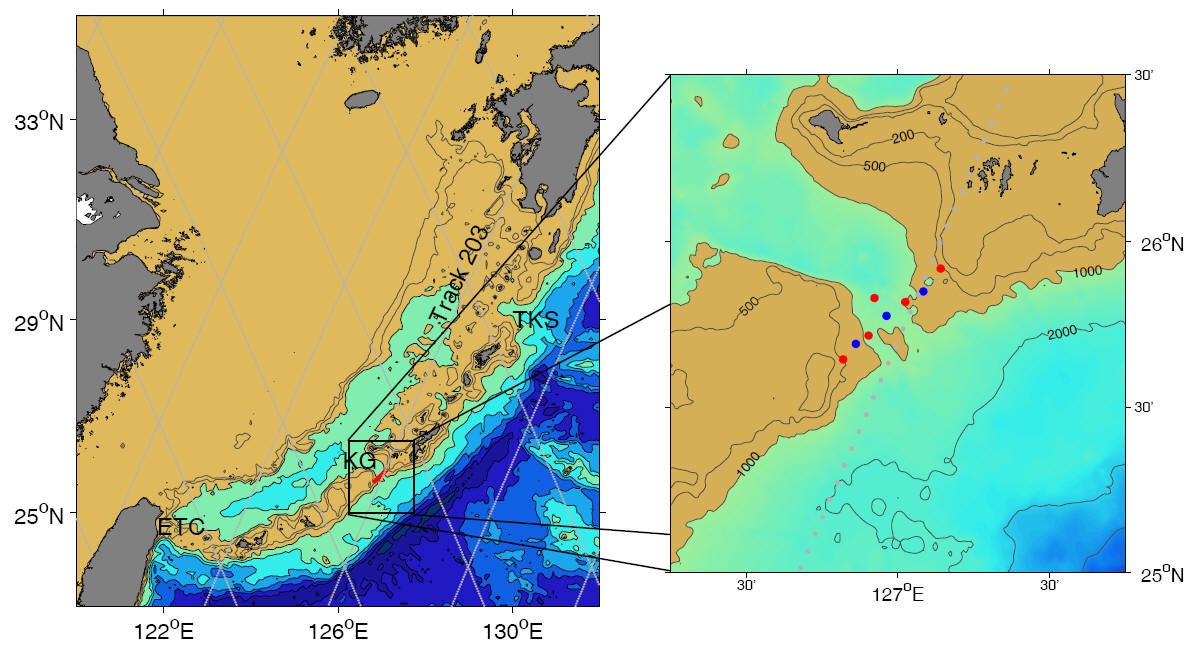
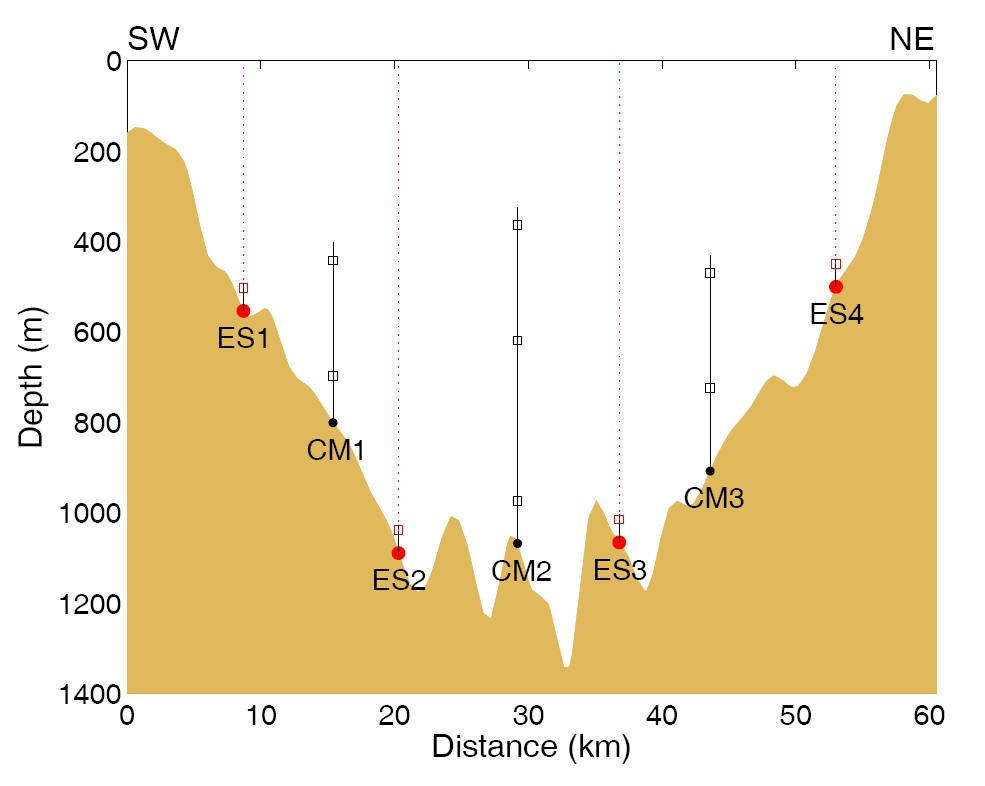
- Determine the time-varying structure and transport of the flow between the Pacific Ocean and the ECS through the Kerama Gap on scales from a few hours to more than a year.
- Test the following three hypotheses:
- increase in transport through the Kerama Gap is associated with (a) an increase in ECS-Kuroshio transport across the PN-line, north of Okinawa, and (b) a decrease in Ryukyu Current transport east of Okinawa about two months earlier;
- the arrival of anticyclonic (cyclonic) eddies at the eastern side of the Kerama Gap is associated with an increase (decrease) of transport through the Gap;
- variations in wind stress over the local region cause variation in the flow through the Kerama Gap.
Publications/Presentations
Annual Reports of ONR Sponsored Research
Published Papers
- Na, H., M. Wimbush, J.-H. Park, H. Nakamura, and A. Nishina. Observations of flow variability through the Kerama Gap between the East China Sea and the northwestern Pacific. J. Geophys. Res., Oceans, 119(2):689–703, 2014. (doi:10.1002/2013JC008899)
- Nakamura, H., A. Nishina, Z. Liu, F. Tanaka, M. Wimbush, and J.-H. Park. Intermediate and deep water formation in the Okinawa Trough. J. Geophys. Res., Oceans, 118(12):6881–6893, 2013. (doi:10.1002/2013JC009326)
Technical Reports
- Liu, Z., H. Na, H. Nakamura, A. Nishina, J.-H. Park, K. Tracey, and M. Wimbush. Kerama Gap 2009-2011 data report. GSO Technical Report 12-02, University of Rhode Island, 2012. (PDF)