Sampling Location
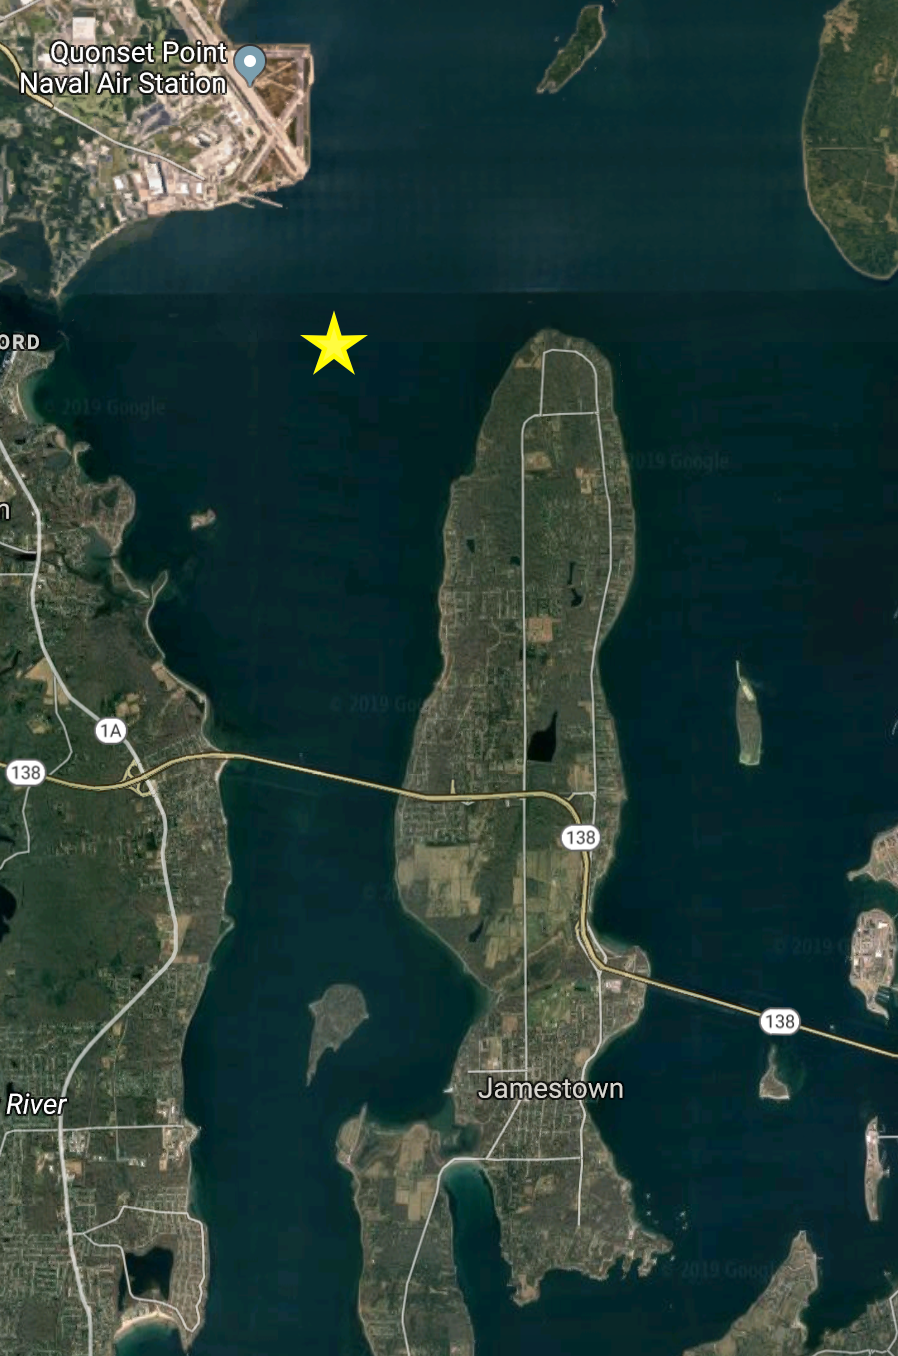
Weekly surface, bottom, and net tow samples are collected from Station II in Narragansett Bay, RI (lat. 41 34.2N; long. 71 23.4W). Scroll below for specifics of each sampling procedure.
Phytoplankton
Previously, equal volumes of surface and bottom water were combined for counting. Currently, surface and bottom water are counted separately (count type indicated with data). Phytoplankton cells are enumerated under a compound microscope using a Sedgewick-Rafter counting chamber. Samples are counted live and unconcentrated. A 20μm net tow sample is also examined; species observed in the net sample are recorded as present but not counted. Species identifications are based on appearance in the Sedgewick-Rafter chamber and supplemented with permanent mounts examined with phase contrast and interference contrast optics. Samples are preserved in 1% Lugol’s preservative. The accurate identification of very small and problematic species is not guaranteed. Quality control of all counts in the database has been conducted on samples collected between 1999 and 2008 and includes analysis of changes in community composition (Windecker, 2010).
Cell count data spreadsheets are available (Microsoft Excel; units = cells per liter). The available data start in January 1999. See Historical Data for earlier data.
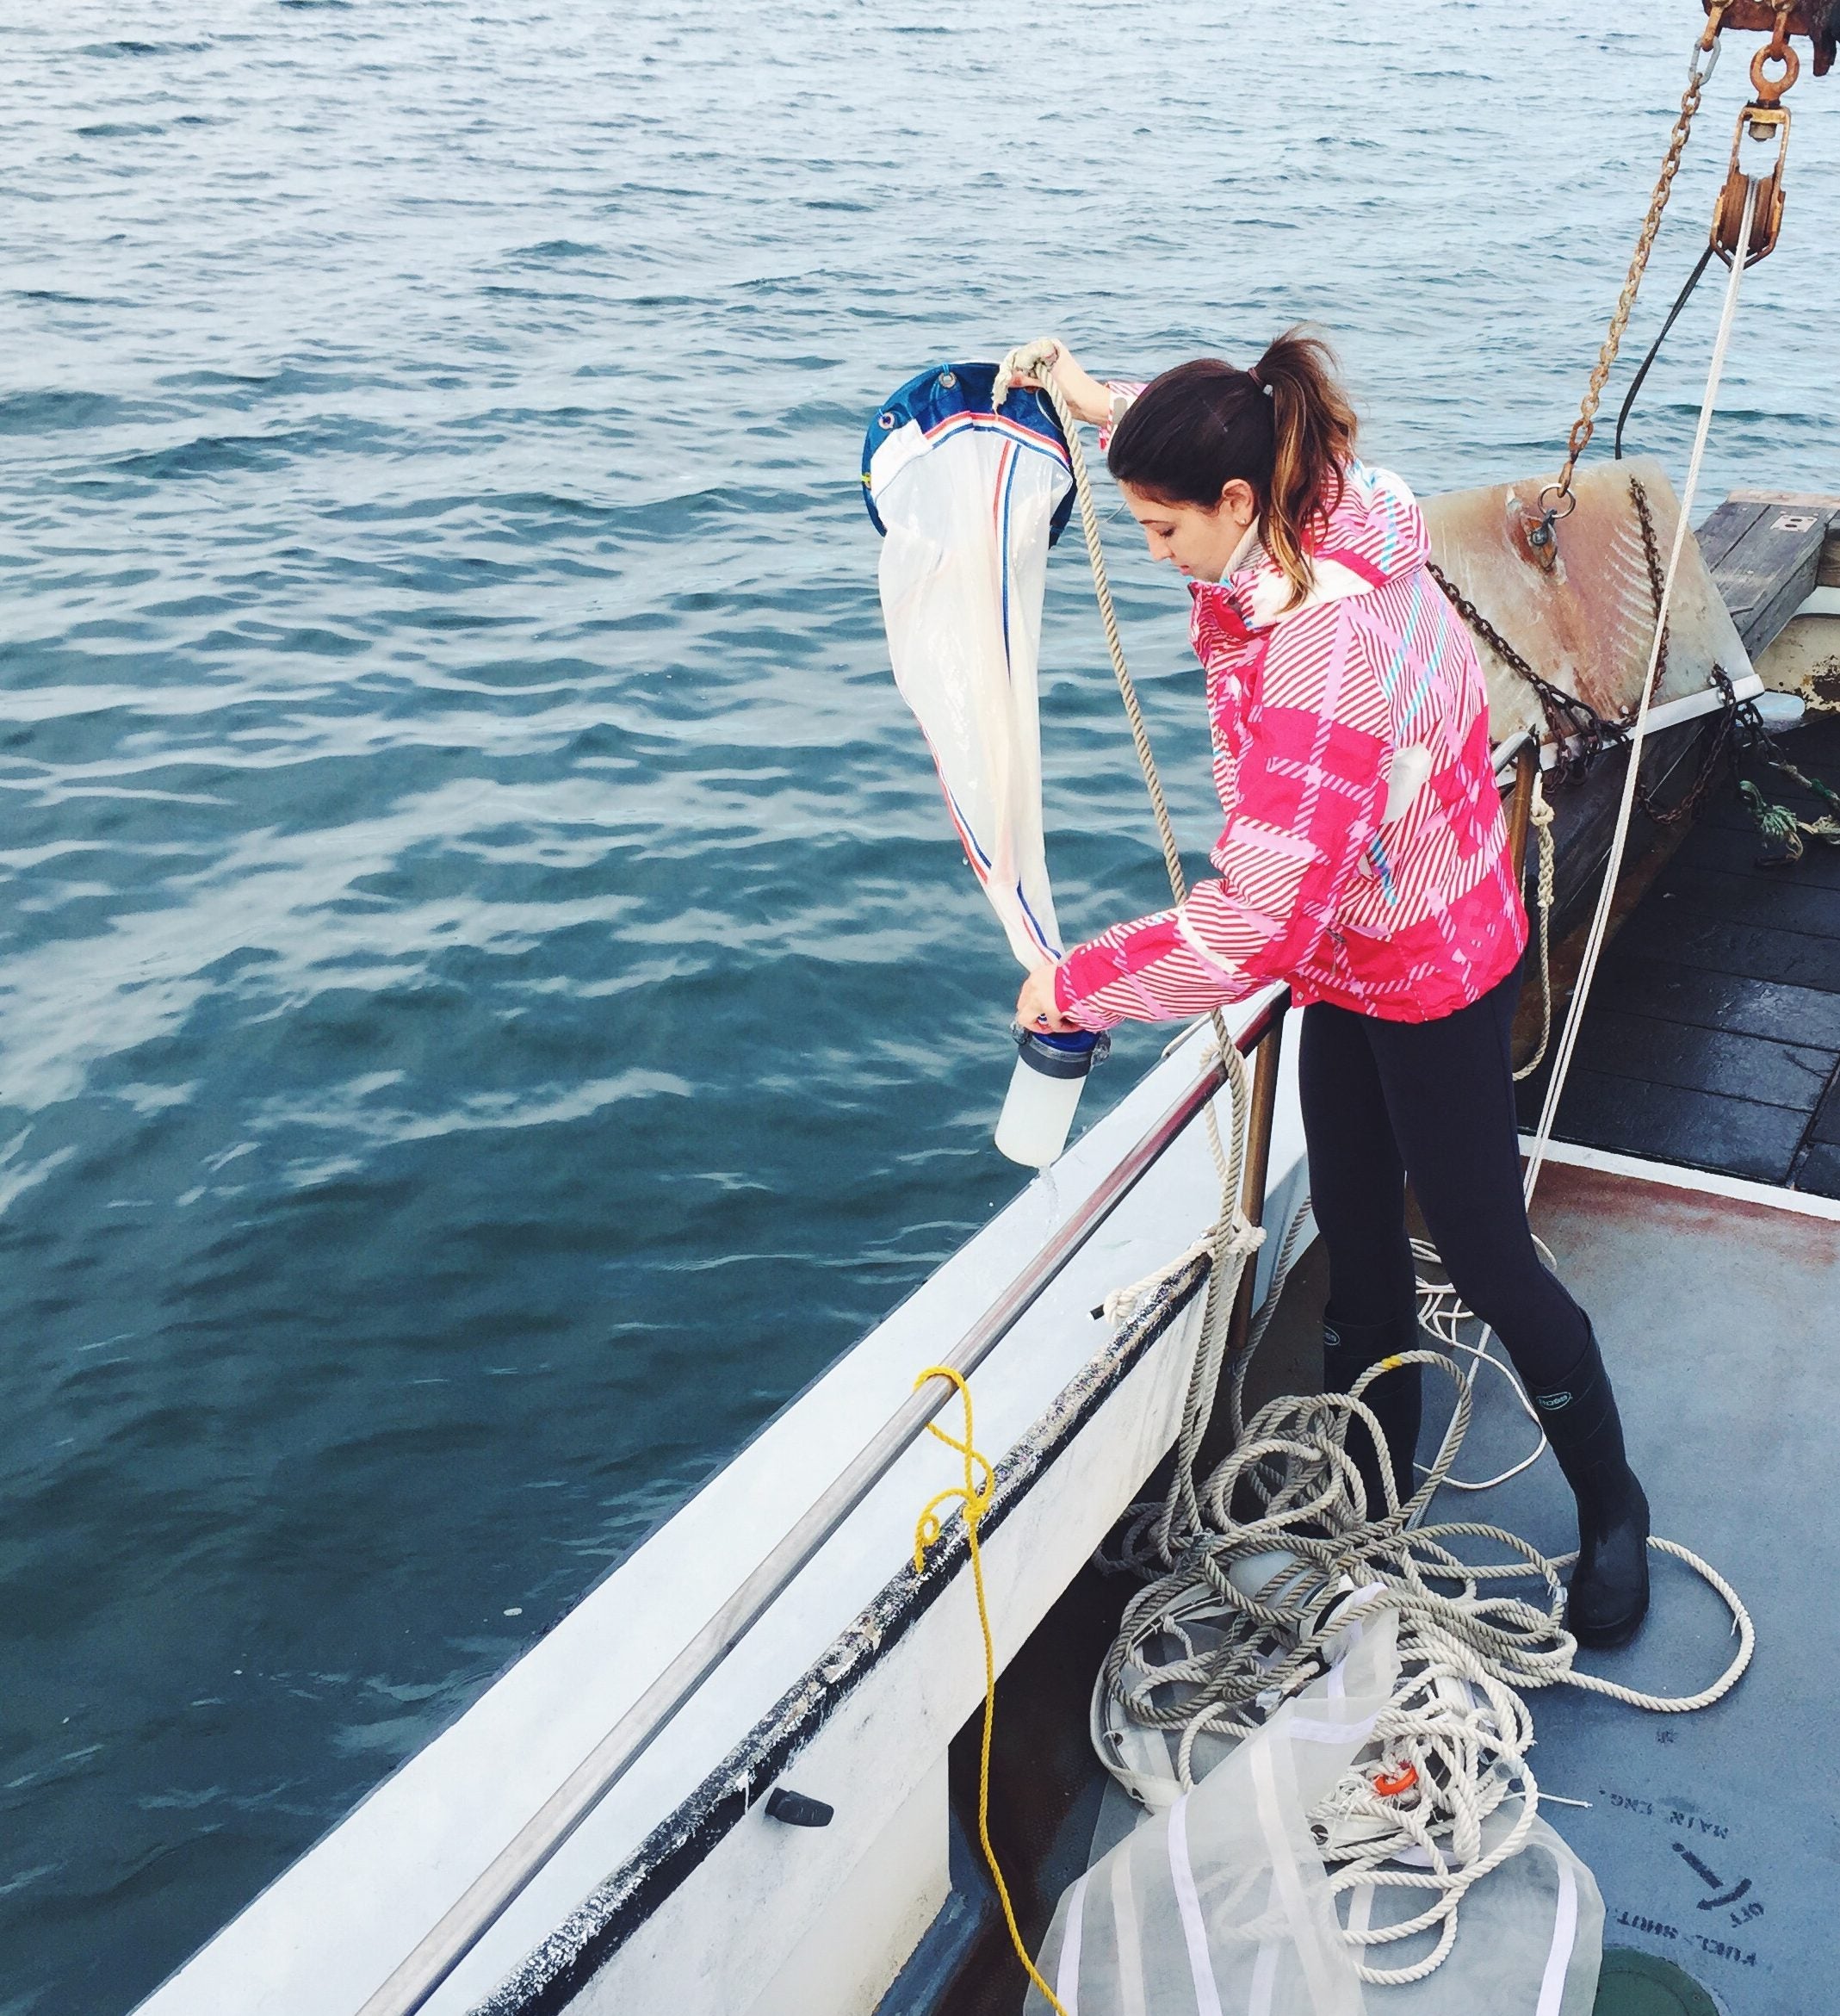
Zooplankton
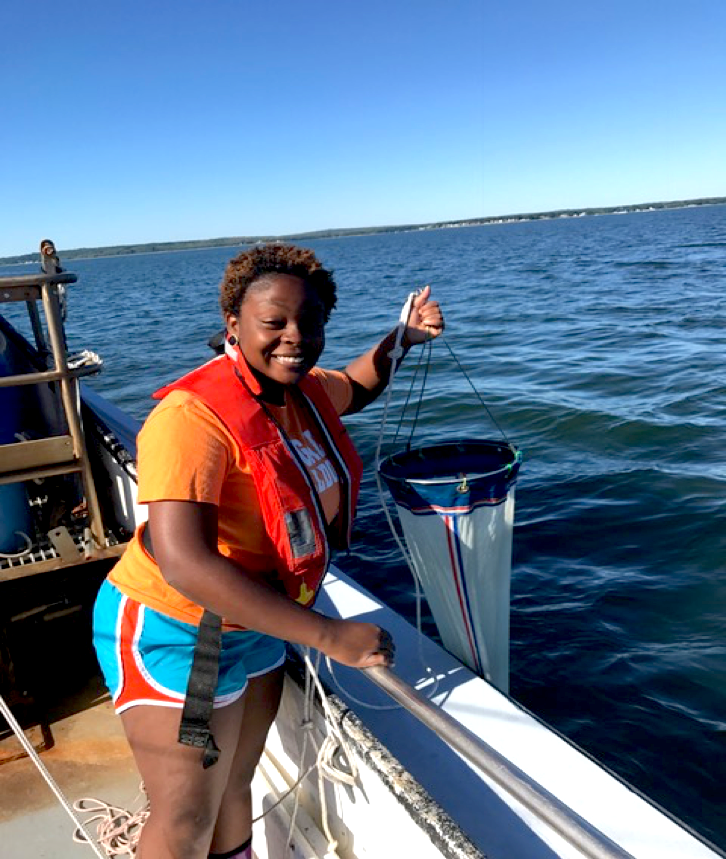
Weekly vertical net tows are taken from 5 m to surface with a ¼ m diameter, 64μm mesh net from the same station at which phytoplankton are collected. The volume filtered is 0.25 m3. The sample is preserved immediately in a final concentration of 4% buffered formalin-seawater solution. Zooplankton are identified and enumerated under a dissecting microscope from a subsample taken with a wide bore pipette calibrated in mls. The subsample volume is chosen to ensure counting of at least 200 organisms. Species identification is made for all copepodite stages of copepods. Copepod nauplii are lumped. Other taxa are identified to species when known, or if not (as for benthic larvae) to order.
Gelatinous species, primarily Mnemiopsis leidyi, are collected with two separate vertical tows combined into one, taken with a ½ m diameter 1 mm mesh net. Samples from 2001-2005 utilized a flow meter. Estimates of the volume filtered for more recent samples are calculated from the depth to which the net is lowered, 5 m. Sample volume is approximately 1.1 m3. The sample is returned to the laboratory and live organisms are counted immediately to ensure that ctenophores, which do not withstand preservation, can be accurately enumerated. Total length of ctenophores and drained volume of the sample was measured through 2005. More recent samples are divided into two size classes (< 1cm and > 1cm) and counted. Samples for 2001-2005 were collected and counted with funding from the National Science Foundation and the Vetleson Foundation Grants to Barbara K. Sullivan, John H. Costello and Dian Gifford. More recent samples were collected by GSO graduate students with funding from the Graduate School of Oceanography and counted by Barbara K. Sullivan.
Zooplankton and data gelatinous zooplankton spreadsheets are available for
download (Microsoft Excel). The available data start in October 2001.
Environmental Data
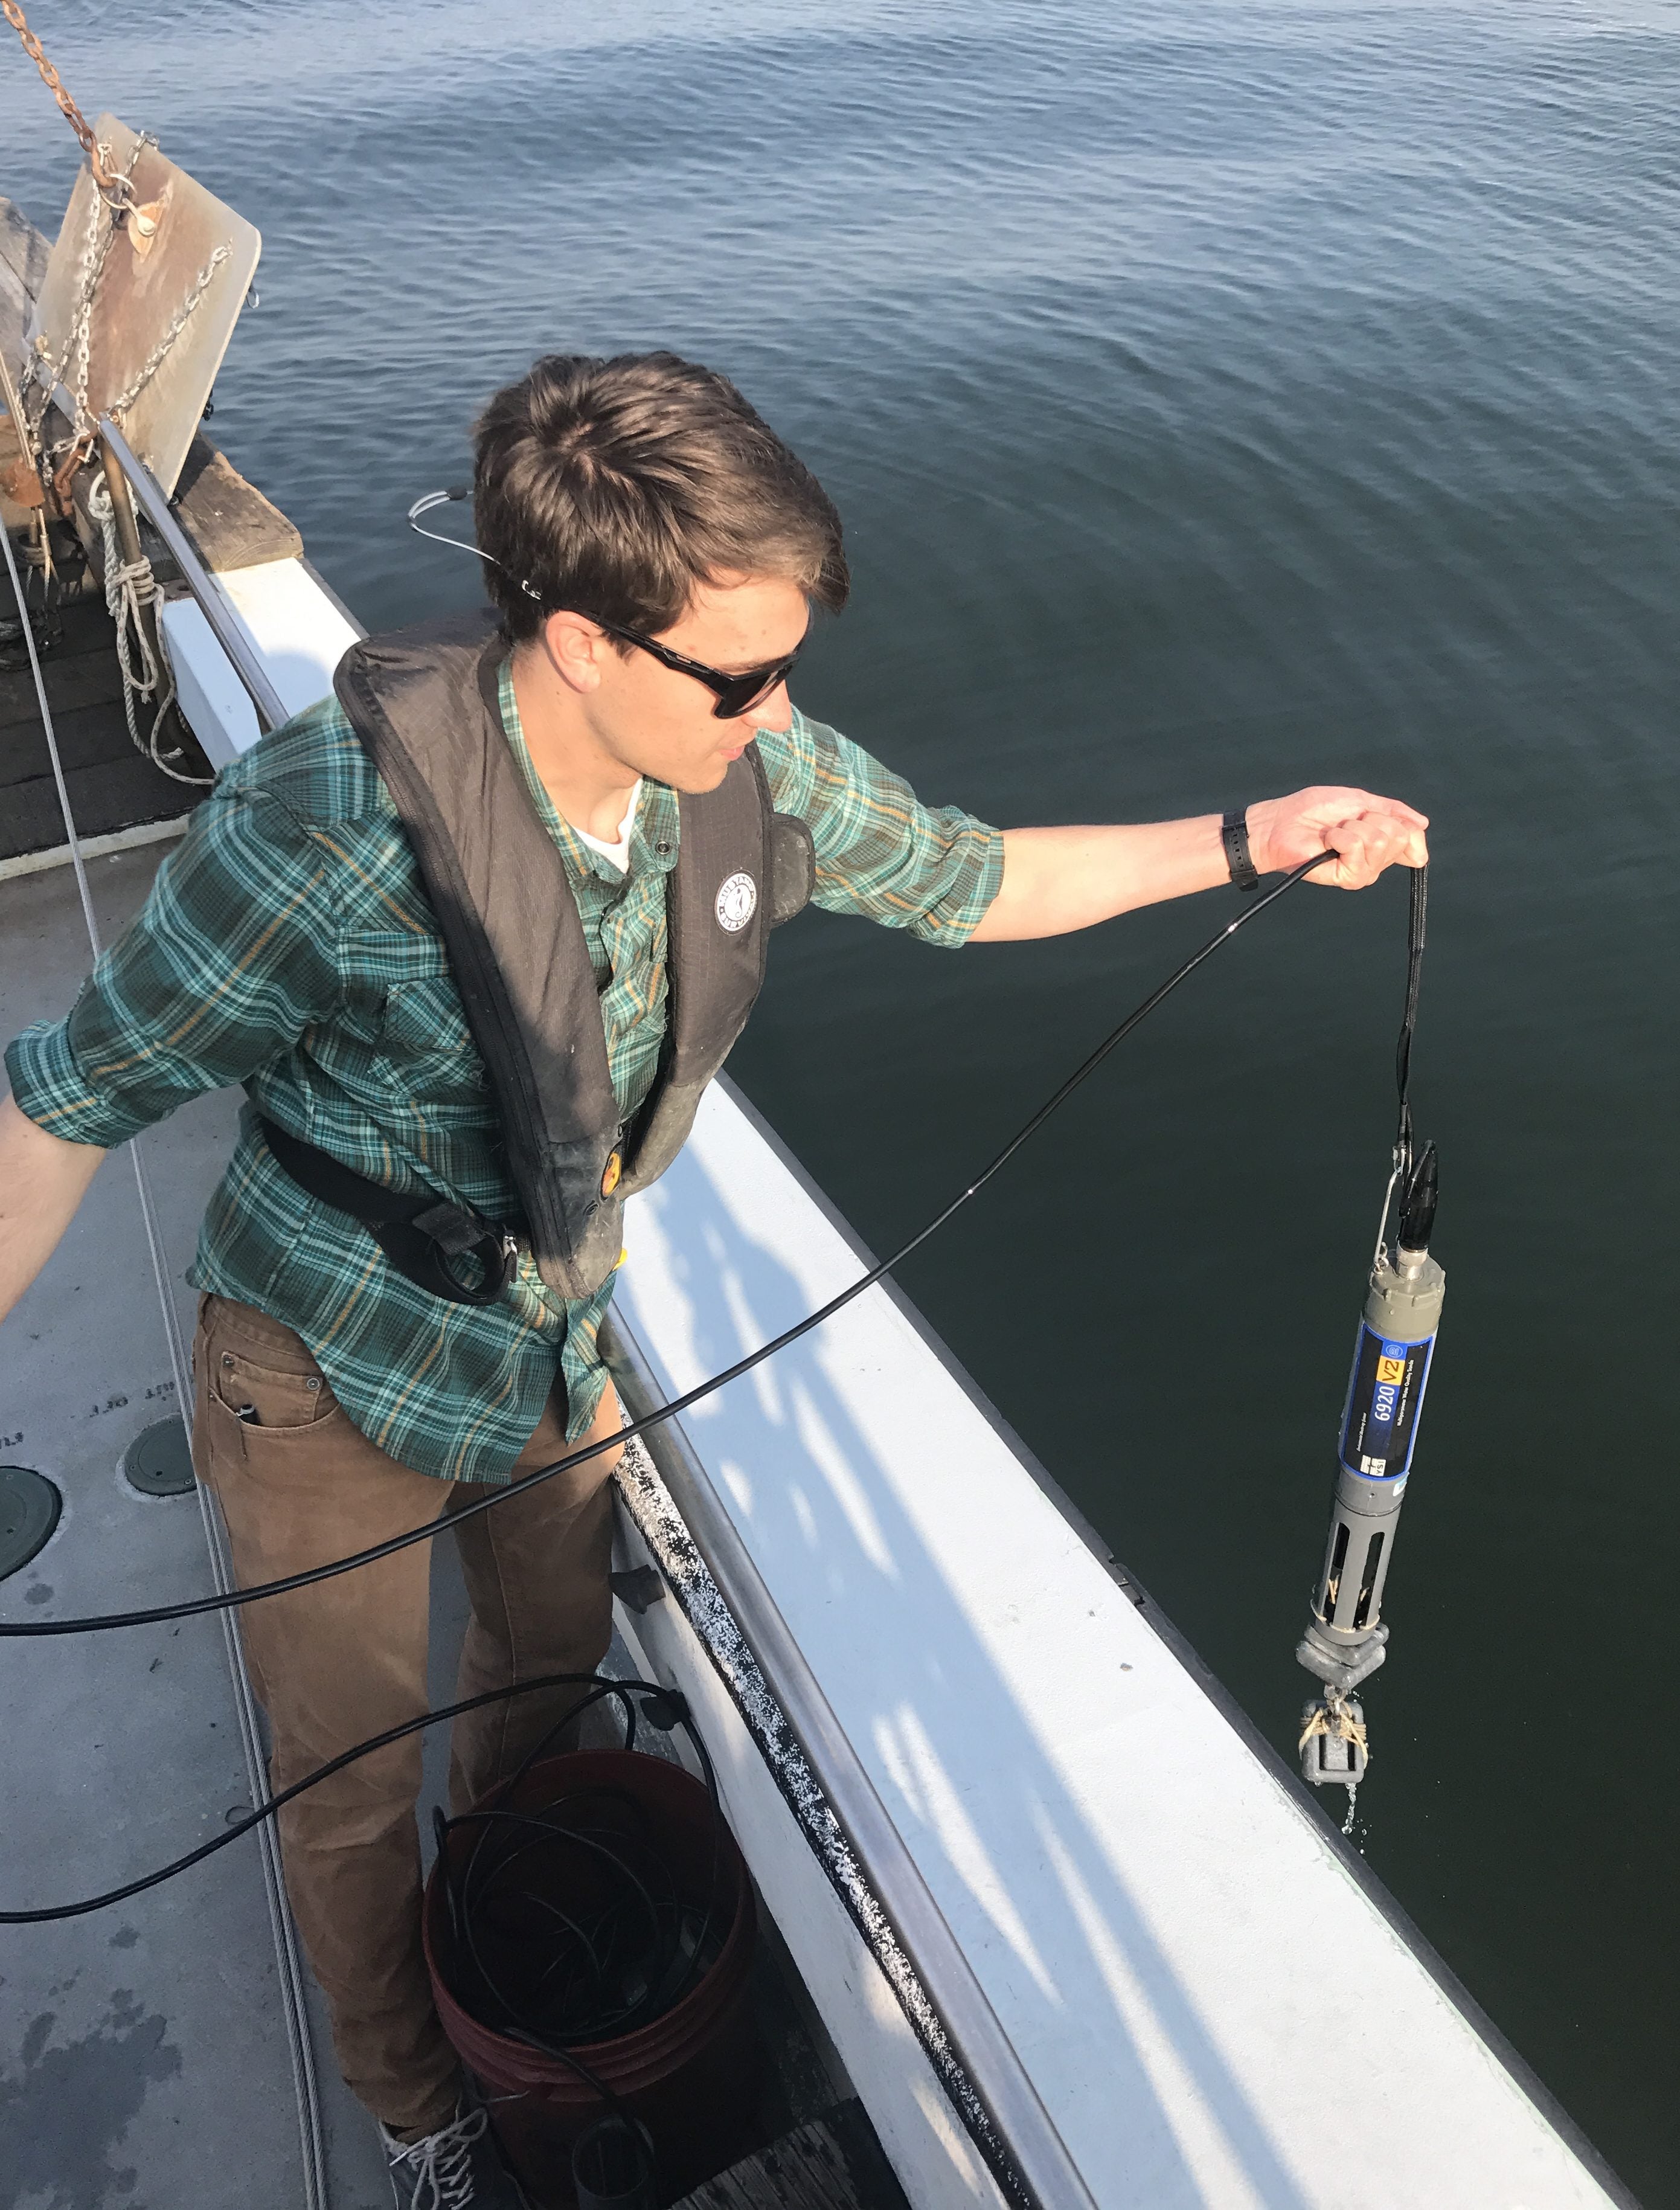
Environmental parameters measured include secchi-disk depth, temperature, salinity and nutrient concentrations. Physical data spreadsheets (including secchi-disk depth, temperature and salinity) are available for download (Microsoft Excel). The available data begin in 1999. Water column profiles of temperature, salinity, depth, pH, dissolved oxygen and chlorophyll fluorescence are also recorded. Please e-mail if you are interested in obtaining water column profile data. Nutrient concentrations are measured in surface and bottom samples. Samples are collected, kept on ice and filtered within a few hours of collection. Filtering is done with an acid washed filtration manifold (60 ml syringe and Millipore filtering tips) using 0.45 mm cellulose filtering membranes. Filtrate is placed in 60 ml polyethelene bottles and frozen at -20ºC until analysis. For further information on nutrient analysis please see our nutrient methods summary.
Nutrient data spreadsheets are available for download (Microsoft Excel). The available data begin in 2003.
Nutrient analysis was conducted through support from RI Sea Grant from 2003-2009.