MERL has produced a variety of datasets since our founding in 1976, some of which continue to this day. Our data has also been referenced in numerous scholarly works, and can be accessed below.
Weekly Bay Sample
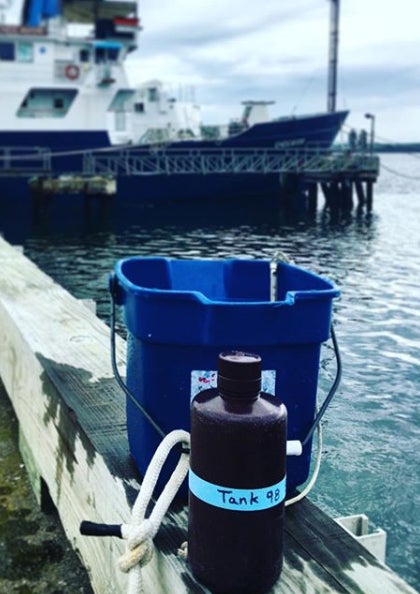 Water samples are collected on a weekly basis, on either Wednesday or Thursday. Samples are taken from the surface waters adjacent to the GSO dock between 9 and 10 a.m.
Chlorophyll concentrations, fluorescence, nutrient (SiO4, NO3, NO2, NH4, and PO4) concentrations, temperature, and salinity are measured for each sample. The data has been collected since 1976, originally from the MERL headtank, and is referred to as “Tank-98” data.
Please note that there are some differences in the types of measurements taken throughout the dataset.
More Information: Download MERL T-98 data here: T-98 Bay to share (.xlsx)
For file, contact LWeber@uri.edu. Data through 2021.
Citation: Reed, Laura and Candace Oviatt. 1976–2021. Marine Ecosystem Research Laboratory, Graduate School of Oceanography, URI, Narragansett, RI.
Narragansett Bay Fixed-Site Monitoring Network
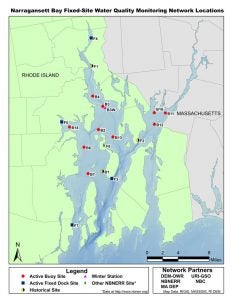
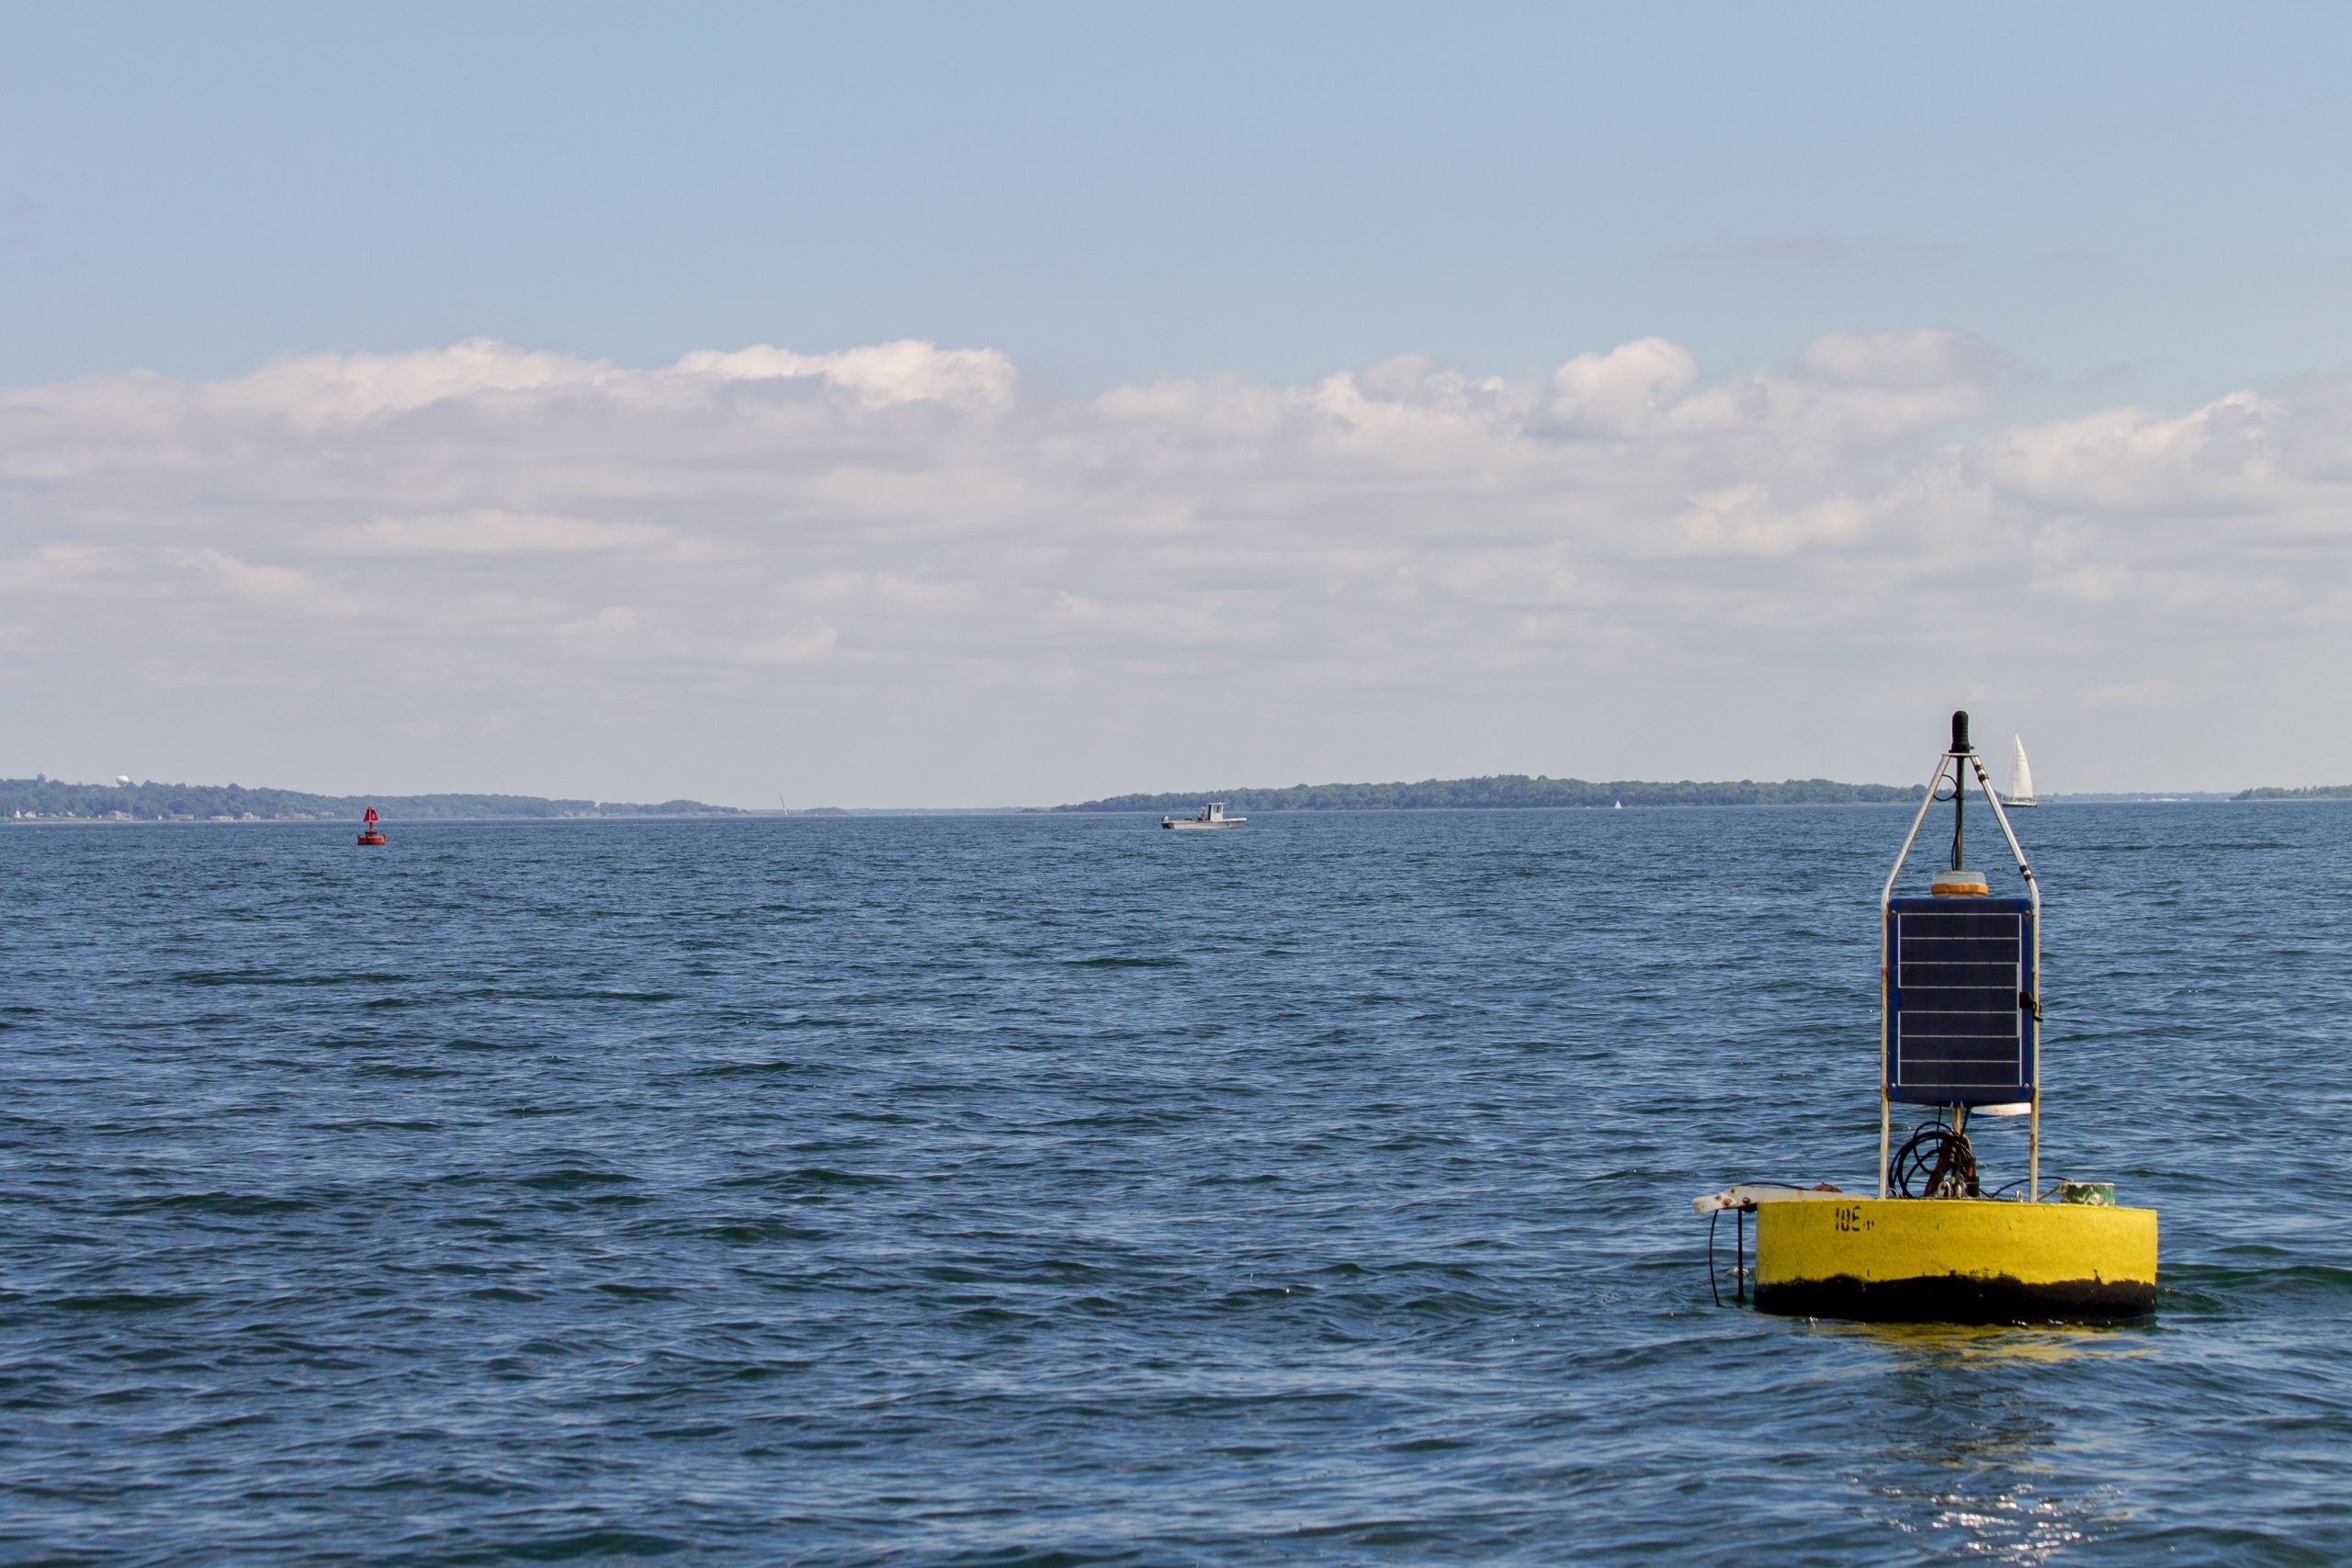 The Narragansett Bay Fixed Site Monitoring Network led by Rhode Island Department of Environmental Management’s Office of Water Resources (RIDEM–OWR) was established in 2005. Station operating partners are Narragansett Bay National Estuarine Research Reserve (NBNERR), Narragansett Bay Commission (NBC), University of Rhode Island’s Graduate School of Oceanography (URI/GSO), and Massachusetts Department of Environmental Protection (MassDEP). As of 2017, the network operates 14 stations throughout Narragansett Bay. These stations consist of year-round land-based stations and summer seasonal buoy stations (May–October). Most stations are equipped with YSI brand instruments measuring near surface and near bottom temperature, salinity, dissolved oxygen, depth, pH, and chlorophyll on 15-minute intervals. All partners use similar methodology and all data are QA/QCd based on an EPA approved QAPP (reference link). Most stations have real-time capabilities.
Citation: For citations, please visit: http://www.dem.ri.gov/programs/emergencyresponse/bart/netdata.php
 NBFSMN website links by partner:
- Real-time links are to raw data that have not been QA/QCd. Real-time raw data are designed for preliminary views of data only. Data analyses should not be conducted on raw data. For QA/QC data downloads visit the RIDEM-OWR webpage for NBFSMN.
- Real-time Data for RIDEM-OWR owned buoys provided by NERACOOS: http://www.neracoos.org/erddap/index.html
- As of 2019, NERACOOS, URI/GSO MERL and RIDEM-OWR are currently sharing real-time links to raw data for B3, B2, B13, F5, B6, B7, and F7 through the NERACOOS ERRDAP server. This site has data downloads and graphic capabilities.
- Real-time Data for Narragansett Bay Commission owned buoys and weekly blogs for the Providence River stations: http://snapshot.narrabay.com/app
- Real-time Data for Narragansett Bay National Estuarine Research Reserve (TWharf station): http://nbnerr.org/research-and-monitoring/
- Weekly blogs posted by RIDEM-OWR: http://www.dem.ri.gov/programs/emergencyresponse/bart/latest.php
- QA/QC data download link: http://www.dem.ri.gov/programs/emergencyresponse/bart/netdata.php
- NBFSMN website maintained by RIDEM-OWR: http://www.dem.ri.gov/programs/emergencyresponse/bart/stations.php
- NBFSMN Daily Average data from 1995-2019 for all stations: https://web.uri.edu/wp-content/uploads/sites/916/nbfsmn_daily_means_thru_2019.csv

MERL Nutrient Dataset
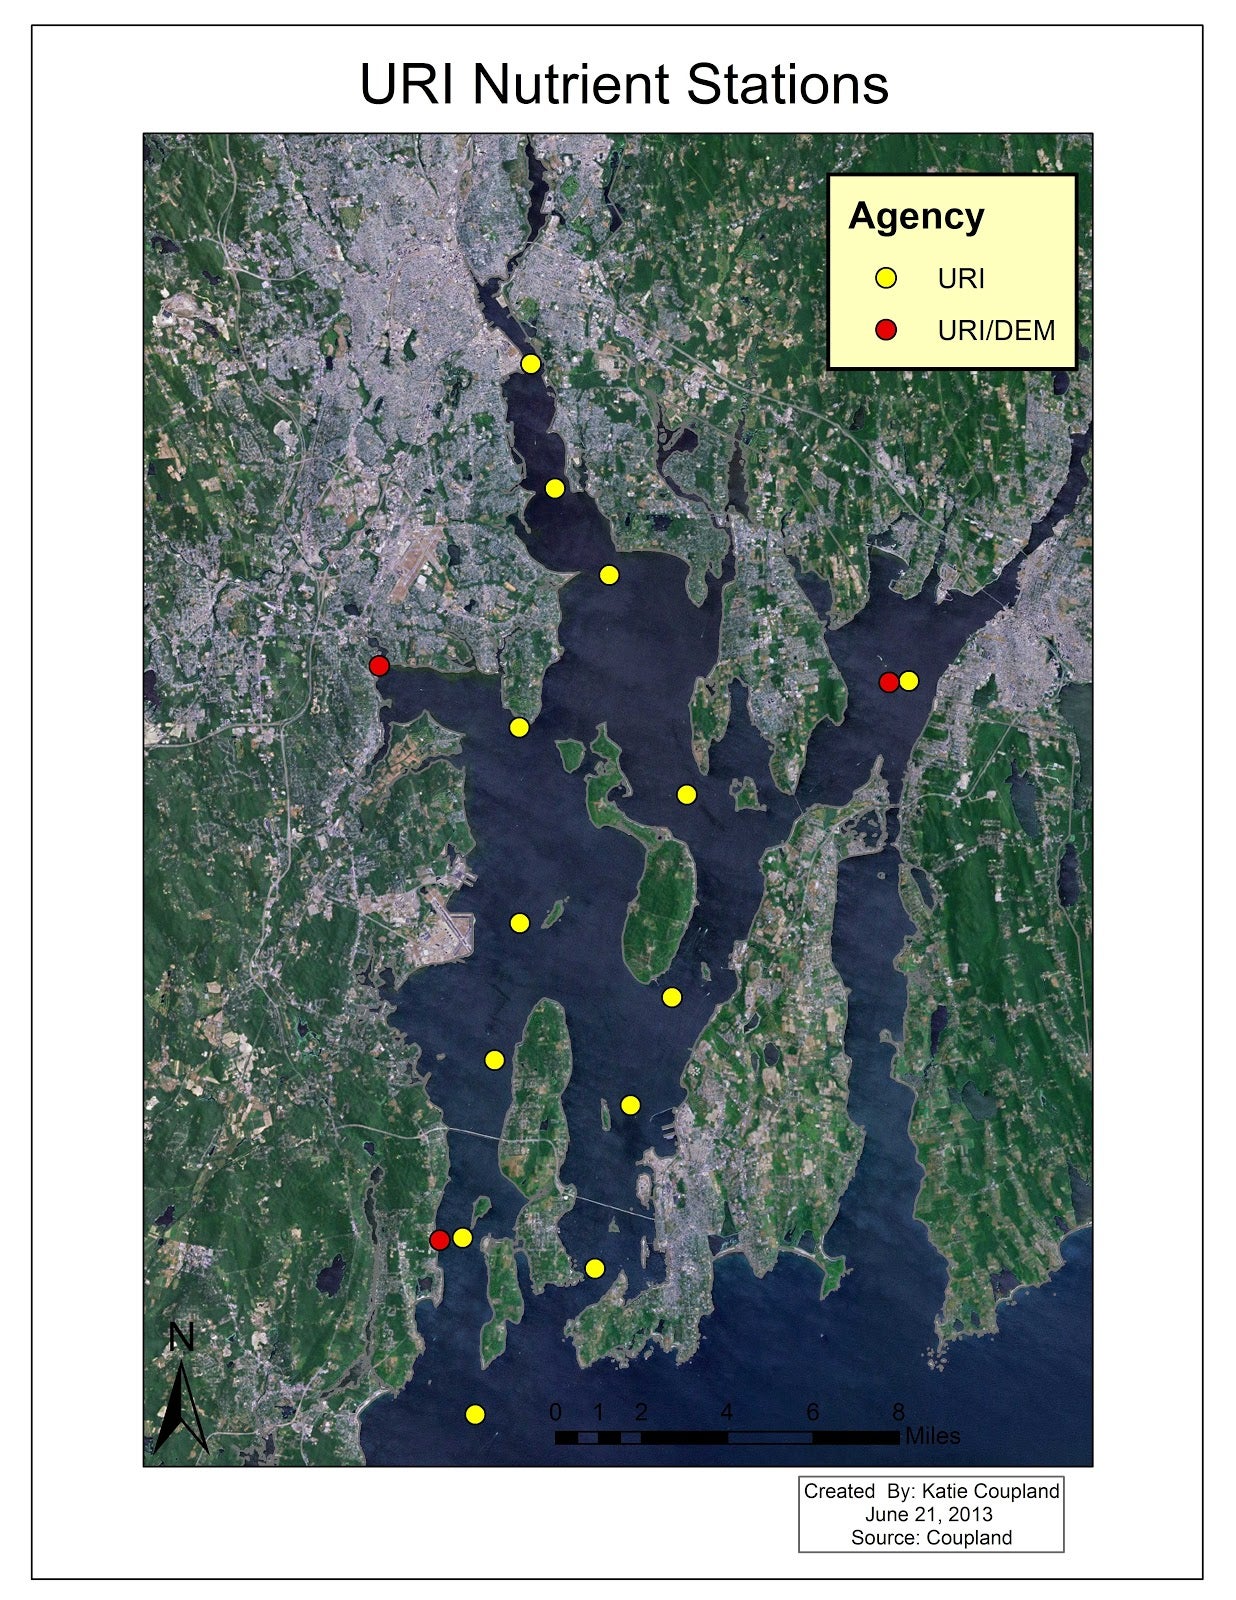 Water samples are collected at 16 stations throughout Narragansett Bay as part of the Coastal Hypoxia Research Program (CHRP). Water samples are analyzed for dissolved inorganic nutrients.
More Information: Download the CHRP Nutrient Dataset here: MERL_CHRP_NUTRIENTS_Data_update_2025 (.xlsx)
For file, contact LWeber@uri.edu.
Citation: Reed, Laura and Candace Oviatt. 2006–2019. Marine Ecosystem Research Laboratory, Graduate School of Oceanography, URI, Narragansett, R.I.
Alkalinity Dataset
Alkalinity samples are taken twice a month from June to August. These samples are analyzed within 24 hours of sample collection. This dataset dates back to 2012. Sample stations are surface and bottom of the following locations based on NBFSMN Map: B4, B3, B2, B14, F5, B6, B7, F7, B13, and B12.
More Information: Download the Alkalinity Dataset:
Historic Datasets
Upper Narragansett Bay Benthic Study
Samples of benthic macrofauna are collected at four sites in Narragansett Bay, RI during June of each year. The sites are located at the north end of Conanicut Island (North Jamestown), at the mouth of Greenwich Bay, off Conimicut Point, and in Mt. Hope Bay. Location data for each of the four stations can be downloaded here: Benthos_Stn_locations (.xls)
Sampling: At each site, 15 replicate cores were hand collected by scuba divers. The core tubes were made of acrylic and measured 30 cm in length and 3.4 cm in diameter. The cores were inserted approximately 15 cm into the sediment and closed at each end with a rubber stopper.
Processing: The top 2 cm of sediment was removed along with any trapped overlying water to analyze separately from the remaining 8 cm. A sub-sample of the 0–2 cm portion was also taken using a 1.2 cm core for enumeration of meiofaunal populations. The samples were preserved in 10% buffered formalin and stained with Rose Bengal dye.
Counting: Each macrofaunal sample was rinsed through stacked 500 and 300 μm sieves. The meiofaunal samples were rinsed through a 37 μm sieve. Organisms retained on the sieves were identified to species level and enumerated. Reference information for the identification of common benthic fauna found in Narragansett Bay may be downloaded here: Benthos_id_sources (.pdf). Abundances were converted to numbers per square meter by taking the mean abundance of the 15 replicates and multiplying by 1 m²/core area. Data, organized by the year that samples were collected, are available to download below. Please note: there is no data available for 2003 and during 2005, only the North Jamestown station was sampled. Analysis of the samples collected in June of 2006 is currently underway.
The following data are in Microsoft Excel Spreadsheet format. Right click and select “Save target as.”
| North Jamestown | Greenwich Bay | Mt. Hope Bay | Conimicut Point | |
|---|---|---|---|---|
| 2000 | Benthos_JTN_2000 | Benthos_GB_2000 | Benthos_MHB_2000 | Benthos_CP_2000 |
| 2001 | Benthos_JTN_2001 | Benthos_GB_2001 | Benthos_MHB_2001 | Benthos_CP_2001 |
| 2002 | Benthos_JTN_2002 | Benthos_GB_2002 | Benthos_MHB_2002 | Benthos_CP_2002 |
| 2004 | Benthos_JTN_2004 | Benthos_GB_2004 | Benthos_MHB_2004 | Benthos_CP_2004 |
| 2005 | Benthos_JTN_2005 | (not sampled) | (not sampled) | (not sampled) |
| 2006 | Benthos_JTN_2006 | (analysis in progress) | (analysis in progress) | (analysis in progress) |
| 2007 | Benthos_JTN_2007 | |||
| 2008 | Benthos_JTN_2008 | |||
| 2010 | Benthos_JTN_2010 |
Citation: Calabretta, Christopher and Candace Oviatt. 1999–2010. Marine Ecosystem Research Laboratory, Graduate School of Oceanography, URI, Narragansett, R.I.